Tag: trading basics

  • What is a Stop-Limit Order? A Beginner’s Guide to Crypto Trading

    What is a Stop-Limit Order? A Beginner’s Guide to Crypto Trading

    What is a Stop-Limit Order?

    A stop-limit order is a type of trading order that combines two instructions:

    • Stop price: The price that triggers the limit order.
    • Limit price: The price at which you are willing to buy or sell, or a better price.

    Once the market reaches the stop price, the exchange places a limit order in the order book.

    However, the trade will execute only if a matching buyer or seller is available at the limit price or a better price.

    In simple terms, a stop-limit order helps traders decide when an order should become active and what price they are willing to accept.

    How does a Stop-Limit Order Work?

    Let’s understand the process with an example.

    Suppose Bitcoin is currently trading at ₹80,00,000. You own some Bitcoin and want to sell if its price starts falling.

    You set the following values:

    Order detailPrice
    Current Bitcoin price₹80,00,000
    Stop price₹78,00,000
    Limit price₹77,50,000

    Here’s what happens:

    Step 1: You place the order

    You enter a stop price of ₹78,00,000 and a limit price of ₹77,50,000.

    Step 2: The market reaches the stop price

    When Bitcoin reaches ₹78,00,000, the stop condition activates.

    Step 3: The limit order enters the order book

    The exchange places your sell limit order at ₹77,50,000.

    Step 4: The order may execute

    If buyers are available at ₹77,50,000 or higher, your order can execute.

    However, if the price drops quickly below ₹77,50,000 and no buyer is available at your limit price, your order may remain unfilled.

    The important difference: The stop price activates the order, but the limit price controls the acceptable execution price.

    What are the Two Types of Stop-Limit Orders?

    Traders generally use stop-limit orders in two ways.

    1. Sell Stop-Limit Order

    A sell stop-limit order helps traders prepare to sell an asset if its price falls to a specified level.

    For example:

    • Current price: ₹80,00,000
    • Stop price: ₹78,00,000
    • Limit price: ₹77,50,000

    When Bitcoin reaches the stop price, the exchange places a sell limit order.

    Traders may use this approach to manage downside risk. However, the order may not execute if the market moves below the limit price too quickly.

    2. Buy Stop-Limit Order

    A buy stop-limit order allows traders to prepare a purchase when the price rises to a specified level.

    For example:

    • Current price: ₹80,00,000
    • Stop price: ₹82,00,000
    • Limit price: ₹82,50,000

    When Bitcoin reaches ₹82,00,000, the exchange places a buy limit order at ₹82,50,000.

    The order can execute at ₹82,50,000 or lower, provided a matching seller is available.

    Traders may use this type of order when they want to enter a position after the market crosses a particular price level.

    Stop-Limit Order vs Stop-Market Order

    Although both orders use a stop price, they work differently after the stop condition activates.

    FeatureStop-Limit OrderStop-Market Order
    TriggerStop priceStop price
    Order placed after triggerLimit orderMarket order
    Price controlYesNo fixed execution price
    Execution guaranteeNoGenerally aims for immediate execution, subject to liquidity and platform rules
    Main riskOrder may remain unfilledExecution may happen at an unfavourable price

    For example, imagine Bitcoin falls sharply after reaching your stop price.

    • With a stop-limit order, your order may remain open if the market moves beyond your limit price.
    • With a stop-market order, the exchange generally attempts to execute the order at the available market price.

    Therefore, a stop-limit order prioritises price control, while a stop-market order prioritises execution.

    What is the Difference Between a Stop-Limit Order and a Regular Limit Order?

    Both orders involve a limit price, but they serve different purposes.

    Regular Limit OrderStop-Limit Order
    Places a limit order directly in the order bookWaits for a stop price to trigger a limit order
    Does not require a separate trigger priceRequires a stop price and a limit price
    Used to buy or sell at a chosen price or betterUsed when a specific market condition should activate the order

    For example, if Bitcoin is trading at ₹80,00,000 and you want to buy at ₹78,00,000, you can place a regular buy limit order.

    However, if you want to buy only after Bitcoin rises to ₹82,00,000, you can use a buy stop-limit order with a suitable stop and limit price.

    Advantages of Using a Stop-Limit Order

    A stop-limit order offers several benefits when used correctly.

    1. Better price control

    You decide the price at which you are willing to buy or sell.

    2. Helps manage trading risk

    You can prepare an exit order in advance instead of reacting manually to every market movement.

    3. Reduces the need for constant monitoring

    Once placed, the order can activate when the specified stop condition is met, subject to the exchange’s order rules.

    4. Supports planned trading strategies

    Traders can use stop-limit orders to plan entries and exits around specific price levels.

    Risks and Limitations of Stop-Limit Orders

    Despite these advantages, stop-limit orders are not perfect.

    1. The order may not execute

    This is the biggest limitation. If the market moves beyond your limit price, the order may remain unfilled.

    2. Fast market movements can create problems

    During sudden price changes, the market may move through both the stop and limit prices before a suitable buyer or seller becomes available.

    3. It does not guarantee a loss limit

    A stop-limit order can help manage risk, but it cannot guarantee that you will sell at your intended price.

    4. Order settings can vary across exchanges

    Some platforms have different trigger-price rules, order conditions, and execution policies. Always check how your exchange handles stop-limit orders before placing one.

    Common Mistakes to Avoid

    Beginners should pay attention to these common mistakes:

    • Confusing the stop price with the limit price.
    • Setting the stop and limit prices without considering market volatility.
    • Assuming that the order will always execute after reaching the stop price.
    • Forgetting to check whether the order is still open or partially filled.
    • Using stop-limit orders without understanding the exchange’s trigger rules.

    Remember, placing an order is only one part of a trading plan. You should also understand your position size, risk tolerance, and exit strategy.

    Frequently Asked Questions (FAQs)

    1. What is a stop-limit order in crypto trading?

    A stop-limit order is a trading instruction that activates a limit order when the market reaches a specified stop price. The trade executes only if a matching order is available at the limit price or better.

    2. What is the difference between a stop price and a limit price?

    The stop price triggers the order. The limit price sets the price at which you are willing to buy or sell.

    3. Can a stop-limit order fail to execute?

    Yes. If the market moves beyond your limit price and no matching order is available, your order may remain unfilled.

    4. Is a stop-limit order the same as a stop-loss order?

    Not exactly. A stop-loss describes the purpose of an order: limiting potential losses. A stop-limit order is one way to place such an exit instruction. A stop-market order is another common approach.

    5. When should traders use a stop-limit order?

    Traders may use it when they want an order to activate at a particular price but also want control over the minimum selling price or maximum buying price.

    Disclaimer: This article is for educational purposes only and does not constitute financial or investment advice. Cryptocurrency trading involves risk. Always understand the order conditions and potential limitations before placing a trade.

  • Risk-Reward Ratio Explained: A Beginner’s Trading Guide

    Introduction

    Every crypto trade involves uncertainty. Prices can move in your favour, but they can also move against you. Therefore, traders need a clear plan for managing potential losses and evaluating possible returns.

    One useful concept is the risk-reward ratio. It helps traders compare how much they are willing to risk on a trade with how much they expect to gain if the trade goes as planned.

    For example, if you are willing to risk ₹100 to potentially earn ₹300, your risk-reward ratio is 1:3.

    However, a higher risk-reward ratio does not guarantee profits. Traders must also consider their win rate, trading costs, market conditions, and execution.

    In this lesson, you will learn what the risk-reward ratio means, how to calculate it, and how traders use it when planning crypto trades.

    What Is the Risk-Reward Ratio?

    The risk-reward ratio compares the potential loss of a trade with its potential profit.

    • Risk: The amount you may lose if the trade reaches your planned stop-loss level.
    • Reward: The amount you may gain if the trade reaches your planned target.

    Traders commonly express this ratio as 1:2, 1:3, or 1:4.

    For example, a 1:2 risk-reward ratio means you are planning to risk ₹1 for a potential reward of ₹2.

    This calculation helps traders evaluate whether a trade offers a reasonable potential reward relative to its planned risk.

    How to Calculate the Risk-Reward Ratio

    You can calculate the risk-reward ratio using a simple formula:

    Risk-Reward Ratio = Potential Loss ÷ Potential Profit

    Let’s understand this with an example.

    Imagine you plan to buy a cryptocurrency at ₹500.

    • Entry price: ₹500
    • Stop-loss price: ₹480
    • Target price: ₹560

    Your potential risk per unit is:

    ₹500 − ₹480 = ₹20

    Your potential reward per unit is:

    ₹560 − ₹500 = ₹60

    Therefore:

    ₹20 ÷ ₹60 = 1:3

    This means you are risking ₹20 for a potential gain of ₹60.

    The trade has a planned risk-reward ratio of 1:3.

    This example excludes trading fees, slippage, funding payments, and other costs. Actual results may differ.

    Common Risk-Reward Ratios Explained

    Traders use different ratios depending on their strategies, market conditions, and trading objectives.

    Risk-Reward RatioAmount RiskedPotential Reward
    1:1₹100₹100
    1:2₹100₹200
    1:3₹100₹300
    1:4₹100₹400
    1:5₹100₹500

    For example, a 1:3 ratio means the potential reward is three times the planned risk.

    However, a higher ratio is not automatically better. A very distant profit target may be less likely to get reached. Therefore, traders should consider realistic price targets rather than choosing a ratio simply because it looks attractive.

    Why Is the Risk-Reward Ratio Important?

    The risk-reward ratio helps traders make more structured decisions before entering a trade.

    1. Helps Evaluate Potential Trades

    Before opening a position, traders can compare the possible loss with the expected gain.

    For instance, if a trade offers a potential reward of ₹100 but requires risking ₹200, a trader may decide that the setup does not meet their trading plan.

    2. Encourages Better Risk Management

    A predefined risk-reward ratio encourages traders to identify their entry, stop-loss, and target levels in advance.

    As a result, they can avoid making decisions based only on emotions or sudden market movements.

    3. Helps Understand the Required Win Rate

    Your win rate is the percentage of trades that close with a profit.

    The risk-reward ratio and win rate work together to determine whether a trading strategy can be profitable over time.

    For example, a trader using a 1:2 ratio does not necessarily need to win every trade to achieve a positive result.

    However, trading fees and losses must also be considered.

    4. Reduces Impulsive Decisions

    Having a predefined target and stop-loss can help traders avoid changing their plans because of fear, greed, or market excitement.

    Nevertheless, no ratio can eliminate the emotional challenges of trading.

    Understanding Risk-Reward Ratio and Win Rate

    A common misconception is that traders must win most of their trades to make a profit.

    In reality, the required win rate depends partly on the risk-reward ratio.

    For example, consider a trader who risks ₹100 to potentially earn ₹200 on every trade.

    ResultAmount
    Profit from one winning trade₹200
    Loss from one losing trade₹100
    Winning trades4
    Losing trades6
    Total profit₹800
    Total loss₹600
    Net result₹200

    In this simplified example, the trader wins only 4 out of 10 trades but still makes ₹200 before trading costs.

    This demonstrates why both win rate and risk-reward ratio matter.

    What Is the Break-Even Win Rate?

    The break-even win rate is the percentage of winning trades required to cover losses over time, before trading costs.

    The simplified formula is:

    Break-Even Win Rate = Risk ÷ (Risk + Reward) × 100

    For a 1:2 risk-reward ratio:

    ₹100 ÷ (₹100 + ₹200) × 100 = 33.33%

    This means a trader needs to win approximately 33.33% of trades to break even before fees and other costs, assuming every trade follows the planned risk and reward amounts.

    In practice, the required win rate may be higher because of fees, slippage, funding payments, and execution differences.

    Risk-Reward Ratio vs Position Sizing

    Although these concepts are connected, they serve different purposes.

    FeatureRisk-Reward RatioPosition Sizing
    MeaningCompares potential loss with potential profitDetermines how much of an asset to trade
    Main purposeEvaluates a trade’s potential payoffControls the amount of capital exposed
    Depends onEntry, stop-loss, and targetAccount size, risk limit, and stop-loss distance
    ExampleRisk ₹100 to potentially earn ₹300Buy 10 units based on the planned risk

    For effective risk management, traders should understand both concepts rather than relying on the risk-reward ratio alone.

    Common Mistakes Beginners Should Avoid

    Even though the calculation is simple, beginners can misunderstand how to use it.

    Avoid these mistakes:

    • Choosing unrealistic profit targets just to achieve a higher ratio.
    • Ignoring the possibility that a stop-loss may execute at a different price.
    • Forgetting trading fees and funding costs.
    • Assuming a 1:3 ratio guarantees profits.
    • Ignoring the win rate of a trading strategy.
    • Increasing position size because a trade appears to offer a favourable ratio.

    Instead, use realistic price levels and calculate your potential risk before entering a position.

    Frequently Asked Questions

    What is a good risk-reward ratio in crypto trading?

    There is no universally ideal ratio. Some traders use 1:2 or 1:3 as planning benchmarks, but the appropriate ratio depends on the strategy, market conditions, and probability of reaching the target.

    Is a 1:3 risk-reward ratio better than 1:2?

    A 1:3 ratio offers a larger potential reward relative to the planned risk. However, the profit target may be harder to reach. Therefore, the win rate and market conditions also matter.

    Can I make a profit with a low win rate?

    Yes. A strategy with a favourable risk-reward ratio may remain profitable even with a lower win rate. However, actual performance depends on execution, trading costs, and consistency.

    Does risk-reward ratio guarantee profits?

    No. It is a planning tool, not a prediction. Market movements, slippage, fees, and unexpected volatility can affect actual results.

    Should beginners use a risk-reward ratio?

    Understanding this concept can help beginners plan trades more carefully. However, they should also learn position sizing, stop-loss orders, and basic risk management before trading with real money.

    Disclaimer: This article is for educational purposes only and does not constitute financial or investment advice. Cryptocurrency trading involves significant risk, and you may lose some or all of your trading capital.

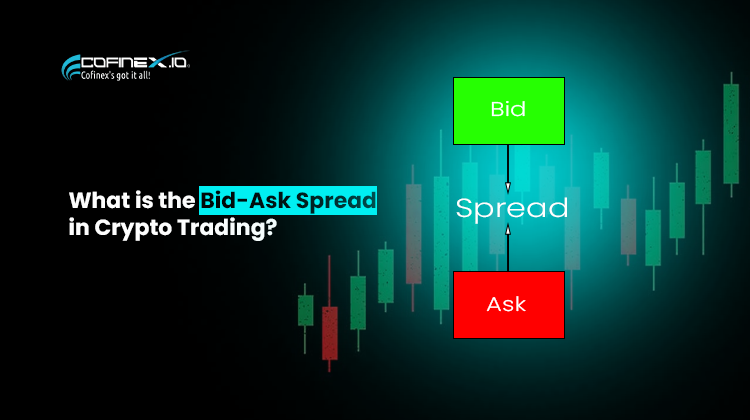
  • What is the Bid-Ask Spread in Crypto Trading?

    What is the Bid-Ask Spread in Crypto Trading?

    Introduction

    When you buy or sell cryptocurrency, the price you see on a trading platform may differ depending on whether you want to buy or sell. This difference relates to an important trading concept called the bid-ask spread.

    The bid is the highest price a buyer currently offers to pay for an asset. In contrast, the ask is the lowest price a seller currently accepts.

    The difference between these two prices is the bid-ask spread. It helps traders understand market liquidity and one of the costs involved in trading.

    Let’s explore how the bid-ask spread works, why it matters, and how you can interpret it as a beginner.

    What Is the Bid-Ask Spread?

    The bid-ask spread is the difference between the highest displayed buying price and the lowest displayed selling price for an asset.

    • Bid price: The highest price a buyer currently offers.
    • Ask price: The lowest price a seller currently requests.
    • Bid-ask spread: The difference between the ask price and the bid price.

    For example, suppose a crypto trading pair displays the following prices:

    • Bid price: ₹99,900
    • Ask price: ₹100,000

    The spread is ₹100.

    This means the lowest displayed selling price is ₹100 higher than the highest displayed buying price.

    However, these prices can change as traders place, modify, or cancel orders.

    How Do You Calculate the Bid-Ask Spread?

    You can calculate the bid-ask spread using a simple formula:

    Bid-ask spread = Ask price − Bid price

    For example, imagine the BTC/INR market shows these prices:

    DetailPrice
    Highest bid₹90,00,000
    Lowest ask₹90,10,000
    Bid-ask spread₹10,000

    To calculate the spread, subtract the bid price from the ask price.

    ₹90,10,000 − ₹90,00,000 = ₹10,000

    Therefore, the bid-ask spread is ₹10,000 per BTC at those displayed prices.

    What Is the Spread Percentage?

    Traders can also express the spread as a percentage to compare markets with different prices.

    A common calculation uses the midpoint between the bid and ask:

    Spread percentage = (Spread ÷ Midpoint) × 100

    In the example above, the midpoint is ₹90,05,000.

    The spread percentage is approximately 0.0111%.

    This percentage helps you compare the spread relative to the asset’s price. However, it does not include other trading costs, such as exchange fees or slippage.

    Why Does the Bid-Ask Spread Matter?

    The bid-ask spread matters because it can affect the price at which you buy or sell an asset.

    1. It Affects Trading Costs

    Suppose you buy an asset at the lowest ask price and immediately sell it at the highest bid price. If the displayed prices remain unchanged, you would receive less than you paid.

    The difference reflects the spread’s immediate impact, excluding trading fees and other costs.

    Therefore, traders should consider the spread when estimating the cost of entering and exiting a position.

    2. It Provides Clues About Liquidity

    A narrow spread often indicates that buyers and sellers are competing closely on price. This situation commonly occurs in markets with strong liquidity.

    On the other hand, a wide spread may indicate limited liquidity, greater uncertainty, or less competition between buyers and sellers.

    However, the spread alone cannot tell you everything about a market’s liquidity. You should also consider order-book depth and available quantities.

    3. It Matters for Frequent Traders

    Frequent traders may pay more attention to the bid-ask spread because they enter and exit positions more often.

    Even a small spread can affect their overall trading costs when they execute many trades.

    Consequently, comparing spreads across trading pairs may help traders understand the costs associated with different markets.

    What Causes the Bid-Ask Spread to Change?

    The bid-ask spread does not remain fixed. Several factors can influence it.

    1. Market Liquidity

    When a market has many active buyers and sellers, their orders may sit closer together. As a result, the spread may become narrower.

    In less liquid markets, buyers and sellers may place orders farther apart, creating a wider spread.

    2. Market Volatility

    During rapid price movements, traders may change or cancel orders quickly.

    Consequently, the gap between the highest bid and lowest ask may widen or fluctuate as market participants respond to changing conditions.

    3. Trading Volume and Activity

    Higher trading activity can attract more competing orders. However, high trading volume does not always guarantee a narrow spread.

    For this reason, traders should examine the actual bid and ask prices rather than relying on volume alone.

    4. Order Size and Market Depth

    The best bid and ask show prices for available quantities, not unlimited amounts.

    A large order may consume several price levels in the order book. Therefore, the final execution price may differ from the best displayed price, even when the initial spread looks narrow.

    Bid-Ask Spread vs Slippage

    Although the bid-ask spread and slippage both affect trading costs, they describe different things.

    FeatureBid-Ask SpreadSlippage
    MeaningDifference between the best displayed ask and bidDifference between the expected and actual execution price
    Main causeGap between buyers’ and sellers’ pricesPrice movement and available liquidity during execution
    When it mattersWhen evaluating displayed market pricesWhen evaluating the actual result of an order
    Can it change?Yes, as the order book changesYes, depending on market conditions and execution

    For example, the spread may be narrow when you place an order. However, if the market moves quickly or your order consumes multiple price levels, you may still experience slippage.

    Therefore, understanding both concepts gives you a clearer picture of trading costs.

    How Can Beginners Check the Bid-Ask Spread?

    Before placing a trade, you can review a few details on your trading platform.

    1. Find the order book: Look for the list of current buy and sell orders.
    2. Identify the highest bid: This is the highest displayed buying price.
    3. Identify the lowest ask: This is the lowest displayed selling price.
    4. Calculate the difference: Subtract the bid from the ask.
    5. Compare the spread: Check how the spread changes over time or across trading pairs.

    Additionally, review the quantities available at each price level. A narrow spread may not be enough to accommodate a large order.

    Common Beginner Mistakes

    Confusing the bid with the ask: The bid represents the highest displayed buying price, while the ask represents the lowest displayed selling price.

    Assuming a narrow spread means zero costs: Trading fees and slippage can still affect your final result.

    Ignoring order-book depth: The displayed best prices may apply to only a small quantity.

    Assuming high volume always means a narrow spread: Actual market conditions determine the spread.

    Forgetting that prices change: The bid and ask can move quickly, particularly during volatile markets.

    FAQs

    What is the bid-ask spread in simple words?

    It is the difference between the highest displayed buying price and the lowest displayed selling price for an asset.

    Is a lower bid-ask spread better?

    A lower spread generally reduces the gap between the best displayed buying and selling prices. However, you should also consider order-book depth, trading fees, and potential slippage.

    What does a wide bid-ask spread mean?

    A wide spread may indicate limited liquidity, greater uncertainty, or less competition between buyers and sellers. However, the spread can widen for several reasons.

    Do I pay the bid-ask spread as a separate fee?

    Usually, the spread is not a separate fee charged by the exchange. Instead, it represents the difference between displayed buying and selling prices. However, it can affect the price you receive when trading.

    Is the bid-ask spread the same as slippage?

    No. The spread measures the gap between the best displayed bid and ask. Slippage measures the difference between an expected price and the actual execution price.

    Disclaimer

    This article is for educational purposes only and does not provide financial or investment advice. Cryptocurrency markets can change rapidly, and spreads, liquidity, fees, and execution prices vary by platform and market conditions.

  • Understanding Support and Resistance in Crypto Trading

    Understanding Support and Resistance in Crypto Trading

    Introduction

    When you look at a crypto price chart, you may notice that prices sometimes stop falling near a particular area and start rising again. Similarly, prices may struggle to move higher after reaching certain levels.

    Traders often study these areas using two important concepts: support and resistance.

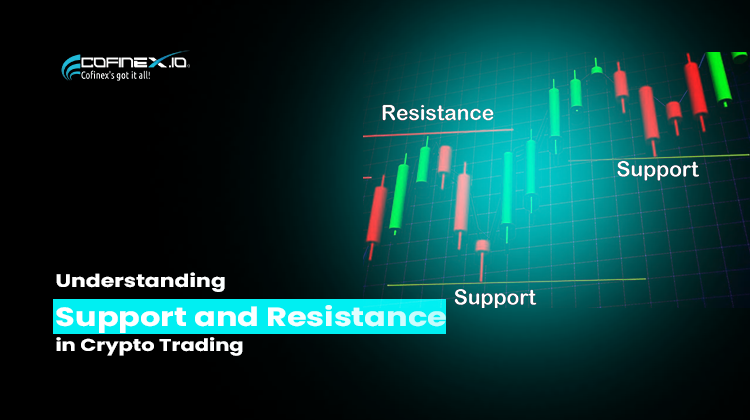
    Support is a price area where buying interest may slow a decline. In contrast, resistance is a price area where selling interest may slow a price increase.

    However, neither level guarantees that the price will reverse. Market conditions can change, and prices can break through both support and resistance.

    In this lesson, you’ll learn how these levels work, how traders identify them, and what beginners should understand before using them.

    What Is Support in Crypto Trading?

    Support is a price area where buying interest may increase enough to slow or temporarily stop a price decline.

    For example, imagine Bitcoin falls towards ₹80,00,000. Buyers begin purchasing near that area, and the price starts moving upward.

    If the price reacts similarly around that area on several occasions, traders may identify it as a support zone.

    However, support does not mean the price cannot fall further. If selling pressure becomes stronger than buying interest, the price may break below the zone.

    Why Does Support Form?

    Several factors can contribute to support:

    • Buying interest: Some traders consider an asset attractive when its price reaches a particular area.
    • Previous price reactions: Traders may watch areas where the price previously stopped falling or bounced upward.
    • Market psychology: Round numbers and widely watched price levels can influence trading decisions.
    • Trading activity: Increased buying activity around a price area may help slow a decline.

    As a result, traders often watch support zones to understand how the market responds to falling prices.

    What Is Resistance in Crypto Trading?

    Resistance is a price area where selling interest may increase enough to slow or temporarily stop a price rise.

    For example, suppose Bitcoin rises towards ₹85,00,000. Some traders sell near that area, and the price begins to fall.

    If the market shows similar reactions around that area repeatedly, traders may identify it as a resistance zone.

    Nevertheless, resistance does not guarantee a price decline. If buying demand becomes strong enough, the price may break above the zone.

    Why Does Resistance Form?

    Resistance can develop for several reasons:

    • Selling interest: Some traders may choose to sell when the price reaches a particular level.
    • Previous price reactions: Traders often watch areas where earlier price increases slowed or reversed.
    • Profit-taking: Traders who bought at lower prices may sell to realise profits.
    • Market psychology: Widely watched price levels can attract buying and selling activity.

    Therefore, resistance zones can help traders identify areas where the market may face selling pressure.

    Support vs Resistance: Key Differences

    FeatureSupportResistance
    LocationOften below the current priceOften above the current price
    Market pressureBuying interest may slow a declineSelling interest may slow an advance
    Possible reactionPrice may bounce upwardPrice may pull back downward
    Breakout directionPrice may break below supportPrice may break above resistance
    ReliabilityNot guaranteed to holdNot guaranteed to hold

    Remember that support and resistance represent price areas, not fixed barriers. Their significance depends on market conditions and price behaviour.

    A Simple Example of Support and Resistance

    Imagine a cryptocurrency trades between ₹100 and ₹120 for several days.

    During this period:

    • The price falls towards ₹100 and then rises several times.
    • The price climbs towards ₹120 and then falls several times.

    Traders may interpret ₹100 as a support zone and ₹120 as a resistance zone.

    If the price approaches ₹100 again, traders may watch whether buying interest appears. Similarly, when the price approaches ₹120, they may observe whether selling pressure increases.

    However, the price could break below ₹100 or above ₹120 at any time. Therefore, traders should not assume that the same pattern will continue indefinitely.

    How Do Traders Identify Support and Resistance?

    Traders use several methods to identify potential support and resistance zones.

    1. Look at Previous Price Reactions

    First, examine the price chart and look for areas where the price repeatedly stopped falling or rising.

    For example, several upward reactions near a similar price may suggest a potential support zone.

    Likewise, repeated downward reactions near a similar price may indicate possible resistance.

    2. Identify Price Zones, Not Just Exact Numbers

    Support and resistance rarely work as perfectly precise lines.

    Instead, traders often mark a zone that covers several nearby price reactions. This approach recognises that buying and selling activity can occur across a range of prices.

    3. Observe Trading Volume

    Trading volume shows how much of an asset traders exchange during a particular period.

    Some traders examine volume when the price approaches a support or resistance zone. A change in volume may provide additional context, although volume alone cannot confirm whether a level will hold or break.

    4. Use Different Timeframes

    A price area that matters on a short-term chart may not carry the same significance on a longer-term chart.

    For this reason, traders sometimes compare multiple timeframes to understand the broader price structure.

    However, no timeframe guarantees a more accurate outcome.

    What Happens When Support or Resistance Breaks?

    Sometimes, the price moves through a support or resistance zone instead of reversing.

    Support Breaks

    When the price moves below support, it may indicate that selling pressure has increased. Some traders then watch whether the price continues falling or returns above the zone.

    In certain situations, a broken support zone may later act as resistance.

    Resistance Breaks

    When the price moves above resistance, it may indicate stronger buying pressure. Traders may then watch whether the price continues rising or falls back below the zone.

    In some cases, a broken resistance zone may later act as support.

    This behaviour is often called role reversal. However, it does not happen every time, and a brief move beyond a level may turn out to be a false breakout.

    Common Beginner Mistakes

    Treating levels as guarantees: Support can break, and resistance can fail.

    Drawing too many lines: Marking every small price movement can make a chart confusing. Focus on meaningful price reactions instead.

    Ignoring market conditions: News, volatility, liquidity, and broader market trends can influence how prices behave around these zones.

    Assuming every breakout will continue: Some breakouts reverse quickly. Traders should consider the wider market context.

    Relying on one signal alone: Support and resistance provide context, but they do not predict future prices with certainty

    FAQs

    What is support in crypto trading?

    Support is a price area where buying interest may slow a decline or encourage a temporary upward reaction.

    What is resistance in crypto trading?

    Resistance is a price area where selling interest may slow a price increase or encourage a temporary downward reaction.

    Can support become resistance?

    Yes. After the price breaks below a support zone, that zone may act as resistance if the price later returns to it. However, this behaviour is not guaranteed.

    Can resistance become support?

    Yes. When the price breaks above resistance, that zone may later act as support if the price returns to it.

    Is support and resistance enough to make a trading decision?

    No. These concepts help traders interpret price behaviour, but they cannot guarantee an outcome. Traders should also consider risk management, market conditions, and other relevant information.

    Disclaimer

    This article is for educational purposes only and does not provide financial or investment advice. Cryptocurrency markets are volatile, and support and resistance levels can fail. Always understand the risks before making trading decisions.

  • What is Liquidity in Crypto Trading? A Beginner’s Guide

    What is Liquidity in Crypto Trading? A Beginner’s Guide

    Introduction

    Have you ever wondered why buying or selling one cryptocurrency feels easy, while trading another can be difficult?

    One important reason is liquidity.

    Liquidity describes how easily an asset can be bought or sold without significantly affecting its market price. In crypto trading, liquidity can influence how quickly an order executes, the difference between buying and selling prices, and the final price you receive.

    For beginners, understanding liquidity can help you make more informed trading decisions. It can also help you understand why some cryptocurrencies experience greater price movements than others.

    In this lesson, we will explain crypto liquidity, how it works, why it matters, and what you should check before placing a trade.

    What is Liquidity in Crypto Trading?

    Crypto liquidity refers to how easily a cryptocurrency can be bought or sold without causing a significant change in its price.

    A market generally has higher liquidity when enough buyers and sellers are available to trade at different prices.

    On the other hand, a market with low liquidity may have fewer buyers and sellers near the current price. As a result, even a relatively small order can move the market price.

    For example, buying Bitcoin in a liquid market may be easier than buying a lesser-known token with limited trading activity. However, liquidity can vary by exchange and trading pair, so you should not assume that every market for the same cryptocurrency has equal liquidity.

    How does Crypto Liquidity work?

    Liquidity depends on the availability of buyers, sellers, and orders in a market.

    Imagine you want to buy a cryptocurrency at ₹100 per token.

    If many sellers are willing to sell near ₹100, your order may execute close to your expected price.

    However, suppose only a few sellers are available at that level. Your order may need to match with sellers asking for higher prices.

    Consequently, you could pay more than expected to complete the purchase.

    The opposite can happen when selling. If there are not enough buyers near the current price, you may need to accept lower prices to sell your entire position.

    This is why liquidity matters when you place market orders.

    What is the difference between High and Low Liquidity?

    High Liquidity

    A highly liquid market generally has enough trading interest and available orders to handle transactions without large price changes.

    Common characteristics include:

    • Many buyers and sellers
    • Orders available near the current market price
    • Generally narrower bid-ask spreads
    • Lower price impact for comparable order sizes

    However, high liquidity does not guarantee a specific execution price or prevent sudden market movements.

    Low Liquidity

    A market with low liquidity may have fewer orders available near the current price.

    Possible characteristics include:

    • Fewer active buyers and sellers
    • Wider bid-ask spreads
    • Greater slippage on market orders
    • Larger price movements from relatively small trades

    Therefore, beginners should pay attention to liquidity before trading unfamiliar or less actively traded tokens.

    What is the Bid-Ask spread?

    The bid-ask spread is the difference between the highest price a buyer is currently willing to pay and the lowest price a seller is currently willing to accept.

    For example:

    Market InformationPrice
    Highest bid₹99
    Lowest ask₹101
    Bid-ask spread₹2

    In this example, the spread is ₹2 per token.

    A narrower spread often indicates better trading conditions, while a wider spread can increase the cost of entering or exiting a trade.

    However, the spread is only one indicator of liquidity. You should also consider the quantity available at each price.

    What is Slippage, and How is it related to Liquidity?

    Slippage occurs when the execution price differs from the price you expected when placing a trade.

    For example, imagine you place a market order to buy 100 tokens. The available sellers may not have enough tokens at the best asking price to fill your entire order.

    As a result, some of your purchase may execute at higher prices.

    This can lead to an average purchase price above your initial expectation.

    Low liquidity can increase the risk of slippage because fewer orders may be available near the current market price. Nevertheless, slippage can also occur in liquid markets during sudden price movements.

    Liquidity vs Trading Volume

    Liquidity and trading volume are related, but they are not the same.

    FeatureLiquidityTrading Volume
    MeaningHow easily an asset can be traded without significantly affecting its priceHow much of an asset is traded during a specific period
    Main focusEase of buying and sellingAmount of completed trading activity
    What to examineSpreads, order-book depth, and price impactVolume over a selected period
    Why it mattersHelps assess trade execution conditionsHelps measure market activity

    For example, a cryptocurrency may show high reported trading volume but still have limited orders available near the current price on a particular exchange.

    Therefore, volume alone does not tell you everything about liquidity.

    What is Market Depth?

    Market depth refers to the quantity of buy and sell orders available at different price levels in an order book.

    A market with greater depth can often accommodate larger orders with less price impact, provided the available orders remain in place.

    For example, suppose a trading pair has many buy orders near the current price. A seller may be able to sell a larger quantity without pushing the price down as much as they would in a shallow market.

    However, displayed orders can change or disappear. Market depth is useful information, but it is not a guarantee that every order will execute as expected.

    Why is Liquidity important for Crypto Traders?

    1. It Can Affect Execution Prices

    Higher liquidity can make it easier to execute orders near the displayed market price.

    In contrast, low liquidity can cause larger differences between the expected and final execution prices.

    2. It Can Affect Trading Costs

    Trading fees are not the only cost to consider. The bid-ask spread and slippage can also affect the total cost of a transaction.

    Therefore, a market with low trading fees is not necessarily the cheapest market to trade in.

    3. It Can Affect Large Orders

    Large orders can consume several levels of available liquidity.

    As a result, splitting an order into smaller orders may sometimes reduce price impact, although this approach does not guarantee a better result and may involve additional fees or execution risks.

    4. It Can Affect Price Volatility

    When fewer orders are available, relatively small trades can move prices more sharply.

    However, liquidity is only one factor that affects volatility. News, market sentiment, and sudden changes in demand can also influence prices.

    How can beginners check Crypto Liquidity?

    Before placing a trade, consider these checks.

    First, check the trading pair. Liquidity can differ between BTC/USDT, BTC/INR, and other pairs involving the same asset.

    Next, examine the bid-ask spread. A narrower spread may indicate more favourable trading conditions.

    Then, review the order book. Look at the quantities available near the current price, not just the best bid and ask.

    After that, compare trading volume. Check the volume for the relevant trading pair and time period.

    Finally, consider your order size. A trade that is small relative to available liquidity may have less price impact than a much larger order.

    Together, these checks can help you better understand the market before trading.

    Common Beginner Mistakes

    Assuming Every Popular Token Has High Liquidity

    Liquidity varies by exchange and trading pair. Always check the specific market you intend to use.

    Looking Only at Trading Volume

    Volume measures completed activity, while liquidity concerns how easily trades can be completed without significant price impact.

    Ignoring the Bid-Ask Spread

    A wider spread can increase the cost of entering or exiting a position.

    Placing Large Market Orders Without Checking the Order Book

    A large order may consume available orders at several price levels, resulting in slippage.

    Assuming Liquidity Never Changes

    Liquidity can decrease quickly during market stress, major announcements, or periods of uncertainty.

    FAQs

    Is high liquidity good for crypto trading?

    Higher liquidity generally makes it easier to trade near the current market price. However, it does not eliminate volatility or guarantee execution at a particular price.

    What happens when a cryptocurrency has low liquidity?

    Low liquidity can make buying or selling more difficult. Traders may face wider spreads, greater slippage, or larger price movements when executing orders.

    Is liquidity the same as trading volume?

    No. Trading volume measures the amount traded during a period, while liquidity describes how easily an asset can be traded without significantly affecting its price.

    How can I check a cryptocurrency’s liquidity?

    Review the bid-ask spread, order-book depth, trading volume, and available quantities near the current price for your specific trading pair.

    Does low liquidity always mean a cryptocurrency is a bad investment?

    Not necessarily. However, it can increase execution risks and make it harder to exit a position at a desired price. Liquidity is one factor to consider alongside other research.

    Disclaimer

    This article is for educational purposes only and does not provide financial or investment advice. Cryptocurrency markets involve risk, and liquidity can change rapidly. Always research the trading pair and understand the potential costs before placing an order.

  • What is Trading Volume?

    What is Trading Volume?

    Introduction

    Have you ever noticed that some cryptocurrencies are traded more actively than others? Some attract many buyers and sellers, while others see very little trading activity. One useful metric that helps you understand this activity is trading volume.

    Trading volume shows how much of a cryptocurrency has been traded during a specific period. It can help traders understand market activity, compare trading interest, and interpret price movements.

    However, high trading volume does not automatically mean a cryptocurrency is a good investment. To understand what the numbers tell you, let’s explore trading volume in simple terms.

    What Is Trading Volume?

    Trading volume refers to the total amount of an asset traded during a specific period, such as one hour, 24 hours, or one day.

    For example, suppose traders buy and sell 500 BTC over a 24-hour period. The reported trading volume for that period may be 500 BTC, depending on the market and the platform’s reporting method.

    Volume can be measured in two common ways:

    • Asset volume: The amount of cryptocurrency traded, such as 500 BTC.
    • Trading value: The total value of those trades in a currency, such as USDT or INR.

    Therefore, always check which unit a platform uses when displaying trading volume.

    How Does Trading Volume Work?

    Every completed trade involves a buyer and a seller. Trading volume measures the amount traded across those transactions.

    Imagine the following trades take place in a BTC/USDT market:

    TradeAmount of BTC traded
    Trade 10.5 BTC
    Trade 21 BTC
    Trade 30.25 BTC
    Total1.75 BTC

    The total trading volume across these three trades is 1.75 BTC.

    Notice that the calculation counts the amount traded, not the number of people participating. A single trader can complete several transactions, and each trade contributes to the reported volume according to the platform’s methodology.

    Why Is Trading Volume Important?

    Trading volume gives traders additional context about price movements.

    1. Understanding Market Activity

    Higher volume generally indicates that more of an asset is being traded during the measured period.

    Lower volume may indicate less trading activity. However, volume can vary depending on the asset, exchange, time of day, and market conditions.

    2. Confirming Price Movements

    Traders often study volume alongside price.

    For example, if a cryptocurrency’s price rises while trading volume also increases, it may indicate stronger participation in that upward movement.

    On the other hand, if the price rises while volume declines, fewer units may be changing hands during the move.

    Nevertheless, neither pattern guarantees what the price will do next.

    3. Comparing Trading Interest

    Volume can help you compare the level of activity across different assets or trading pairs.

    However, make sure you compare similar time periods and units. A 24-hour volume figure should not be compared directly with a one-hour figure without accounting for the difference.

    4. Supporting Trading Decisions

    Traders may use volume alongside price charts, order books, and other indicators to understand market conditions.

    For example, a trader may examine whether a breakout occurs alongside increased trading activity.

    Still, volume is only one piece of information. It cannot predict market direction on its own.

    What Is the Difference Between High and Low Trading Volume?

    Does the Momentum Indicator Confirm Trend Strength? | EBC Financial Group

    High Trading Volume

    A larger amount of the asset is traded during the selected period. This can reflect increased market activity, but it does not necessarily mean the price will rise.

    Graph Chart Stock Market Candle Stick Trade Business Data Growth Money Diagram blur Blue Background, Abstract Global Forex Bitcoin Crypto currency, Technology Analysis Exchange Profit Success.

    Low Trading Volume

    A smaller amount of the asset is traded during the selected period. Depending on the market, this may mean fewer trading opportunities or less liquidity near the current price.

    Importantly, trading volume and liquidity are not the same thing. Volume measures trading activity over a period, while liquidity describes how easily an asset can be bought or sold without significantly affecting its price.

    What Does Volume Tell You About Price Movements?

    Traders often look at price and volume together because the combination can provide more context than either metric alone.

    Price Rises and Volume Increases

    This may indicate growing participation in the upward move. However, it does not guarantee that the trend will continue.

    Price Falls and Volume Increases

    This may indicate strong trading activity during a decline. It does not, by itself, prove that the price will continue falling.

    Price Moves With Low Volume

    A price movement with relatively low volume may have less participation behind it. Still, the significance depends on the asset and the wider market.

    Volume Spikes Suddenly

    A sudden increase in volume can occur around major announcements, market volatility, liquidations, or other events.

    Therefore, check the context before drawing conclusions from a volume spike.

    What Is a Trading Volume Chart?

    A trading volume chart often appears below a cryptocurrency’s price chart.

    It commonly displays vertical bars, with each bar representing the volume traded during a particular time interval.

    For example:

    • A one-minute chart shows volume for each minute.
    • An hourly chart shows volume for each hour.
    • A daily chart shows volume for each day.

    Some charts use different colours to distinguish periods when prices rose or fell. However, the exact colour conventions depend on the charting platform.

    When reading a volume chart, compare recent bars with previous bars from the same chart and time frame. This helps you understand whether trading activity is unusually high or low for that market.

    What Is the Difference Between Trading Volume and Market Capitalization?

    These two metrics describe different things.

    FeatureTrading VolumeMarket Capitalization
    What it measuresTrading activity during a periodCurrent market value of circulating tokens
    Basic calculationTotal amount tradedPrice × circulating supply
    Changes whenTrading activity changesPrice or circulating supply changes
    What it helps explainHow actively an asset is tradedThe asset’s market value based on circulating supply

    For example, a cryptocurrency may have a large market capitalization but relatively low daily trading volume. Another asset may have a smaller market capitalization but trade actively.

    Consequently, neither metric should be used alone to judge an asset.

    Common Beginner Mistakes

    Assuming high volume means the price will rise. High volume can occur during both upward and downward price movements.

    Ignoring the time frame. One-hour volume and 24-hour volume describe different periods.

    Confusing volume with liquidity. An asset can record substantial volume but still experience poor liquidity at a particular moment or on a particular exchange.

    Comparing figures without checking the units. Some platforms report volume in the traded cryptocurrency, while others display its estimated value in a currency.

    Trusting every reported figure. Volume data quality can vary across exchanges and data providers. Reported activity may not always reflect the same level of genuine market participation.

    FAQs

    Is high trading volume good for a cryptocurrency?

    High volume can indicate active trading, but it does not automatically make an asset a good investment. Consider liquidity, price behaviour, market conditions, and the reliability of the data.

    Does high trading volume mean the price will increase?

    No. High volume can accompany rising prices, falling prices, or periods of sharp volatility.

    What does 24-hour trading volume mean?

    It represents the reported amount traded over a 24-hour period. Depending on the platform, it may be shown in cryptocurrency units or monetary value.

    Is trading volume the same as liquidity?

    No. Volume measures completed trading activity over a period. Liquidity describes how easily an asset can be traded without significantly affecting its price.

    Where can I check crypto trading volume?

    You can usually find volume figures on cryptocurrency exchange trading pages and market-data platforms. Compare similar time periods and check how each platform calculates its figures.

    Disclaimer

    This article is for educational purposes only and does not provide financial or investment advice. Cryptocurrency markets involve risk, and trading volume cannot predict future price movements or guarantee trading outcomes.

  • What is a Stop-Loss Order?

    Introduction

    Crypto prices can change quickly. A cryptocurrency that trades at ₹1,000 today may fall sharply within a short period. For traders, these movements can create opportunities, but they can also lead to unexpected losses.

    So, how can traders plan for a situation where the market moves against them?

    One tool they can use is a stop-loss order.

    A stop-loss order helps traders manage risk by triggering an order when the market reaches a specified price. However, it does not guarantee that the trade will close at exactly that price.

    In this lesson, we will explain how stop-loss orders work, explore a simple example, and discuss the mistakes beginners should avoid.

    What Is a Stop-Loss Order?

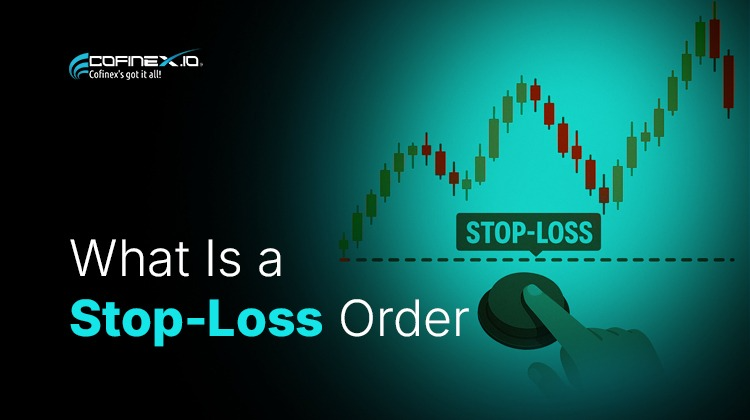
    A stop-loss order is a trading instruction designed to help limit potential losses on a position.

    A trader sets a stop price. If the market reaches that price, the exchange activates the order according to its rules.

    For example, imagine you buy Bitcoin at ₹10,00,000 per unit for illustration purposes. You decide that you want to exit the trade if the price falls to ₹9,50,000.

    You can set a stop-loss at ₹9,50,000.

    If the relevant price reaches that level, the order is triggered. Depending on the order type and market conditions, the final selling price may be different from the stop price.

    In simple terms, a stop-loss helps you plan an exit before a trade moves further against you.

    How Does a Stop-Loss Order Work?

    A typical stop-loss process has three main steps.

    1. Enter a trade: You buy or sell a cryptocurrency.
    2. Set a stop price: You choose the price at which you want the exit process to begin.
    3. Order triggers: If the market reaches the trigger level, the exchange activates the specified order.

    The exact process depends on the exchange and the order type you select.

    For example, some platforms offer stop-market orders, while others also offer stop-limit orders. These options work differently, so beginners should understand the available settings before placing an order.

    A Simple Stop-Loss Example

    Imagine you buy a cryptocurrency at ₹1,000 per coin.

    You set a stop price at ₹950 because you want to limit the loss if the price moves downward.

    Illustrative trade setup

    Entry price

    ₹1,000

    Stop price

    ₹950

    Planned price difference: ₹50 per coin

    A 5% decline from the entry price, before fees and slippage.

    If the order executes at ₹950, the price difference is ₹50 per coin. However, the actual loss may be larger if the order executes below ₹950.

    Likewise, if the market price rises instead, the stop-loss may never trigger.

    This example assumes a long position where you buy first and plan to sell later.

    What Are the Different Types of Stop-Loss Orders?

    Two common types are stop-market and stop-limit orders.

    1. Stop-Market Order

    A stop-market order triggers a market order when the stop price is reached.

    Once triggered, the order generally seeks execution at the best available market prices.

    Advantage: It prioritizes execution after the trigger.

    Limitation: The final execution price is not guaranteed. In a fast-moving market, the trade may execute below the stop price for a sell order.

    2. Stop-Limit Order

    A stop-limit order uses two prices:

    • Stop price: Activates the order.
    • Limit price: Sets the minimum acceptable selling price for a sell limit order.

    For example, you set a stop price of ₹950 and a limit price of ₹945.

    When the stop price is reached, the exchange places a limit order at the specified price. However, the order may remain unfilled if buyers are not available at an acceptable price.

    Advantage: It provides more control over the minimum selling price.

    Limitation: It does not guarantee execution.

    The choice depends on whether your priority is execution or price control, along with the exchange’s available order features.

    Stop-Market vs Stop-Limit

    FeatureStop-MarketStop-Limit
    Trigger priceYesYes
    Execution type after triggerMarket orderLimit order
    Price guaranteeNoLimit price constrains execution
    Execution guaranteeNot absoluteNo
    Main concernSlippageOrder may remain unfilled

    Remember that exchanges can use different names and trigger rules. Always check the order details on your trading platform.

    How Do You Choose a Stop-Loss Price?

    There is no single stop-loss level that works for every trade.

    Instead, traders may consider several factors.

    Market volatility: A highly volatile asset can move sharply within a short period.

    Trading strategy: A short-term trade may use different exit rules from a longer-term position.

    Price levels: Some traders study support levels or other technical indicators when planning an exit.

    Risk tolerance: The potential loss should fit the trader’s overall risk plan.

    However, setting a stop-loss too close to the entry price can cause an exit during ordinary market fluctuations. Setting it too far away can expose the trader to a larger loss.

    Therefore, traders should plan the stop level alongside their position size, rather than choosing a price randomly.

    Can a Stop-Loss Order Guarantee That You Won’t Lose More?

    No. A stop-loss is a risk-management tool, not a guarantee against losses.

    Several situations can affect the final result:

    • Slippage: The order executes at a different price from the expected level.
    • Price gaps or rapid moves: The market moves past the stop price before execution.
    • Low liquidity: There may not be enough buyers or sellers near the desired price.
    • Stop-limit non-execution: The market does not reach the limit price needed to fill the order.
    • Platform-specific rules: Trigger prices and order handling can vary between exchanges.

    For this reason, traders should understand both the benefits and the limitations of stop-loss orders.

    Common Stop-Loss Mistakes Beginners Make

    Setting a Stop Price Without a Plan

    A stop-loss should fit the trading strategy and the amount of risk the trader is prepared to accept.

    Assuming the Stop Price Is the Final Price

    A trigger price and an execution price are not always the same.

    Ignoring Position Size

    Even with a stop-loss, a large position can create a substantial loss.

    Using Stop-Limit Orders Without Understanding Them

    A stop-limit order may not execute when the market moves quickly.

    Moving the Stop-Loss Out of Fear

    Repeatedly moving a stop farther away can undermine the original risk plan.

    Forgetting Fees

    Trading fees and slippage can increase the final cost of a trade.

    How Does a Stop-Loss Fit Into Risk Management?

    A stop-loss works best as part of a broader trading plan.

    Before entering a trade, a trader can decide:

    1. The planned entry price.
    2. The price level where the trade idea no longer makes sense.
    3. The position size.
    4. The potential loss if the exit executes.
    5. The potential reward relative to that risk.

    For example, if a trader plans a ₹50 price risk per coin, the number of coins they buy will influence the total potential loss.

    This is why position sizing and stop-loss planning should work together.

    Even so, the actual loss can differ from the estimate because execution is not always guaranteed at the stop price.

    FAQs

    Is a stop-loss order necessary for every crypto trade?

    Not every strategy uses a stop-loss order, but traders should have a clear plan for managing risk and exiting a position.

    Can a stop-loss trigger during a sudden price drop?

    Yes. If the relevant trigger condition is met, the order may activate. However, the final execution depends on the order type and market conditions.

    What is the difference between a stop-loss and a limit order?

    A stop-loss is designed to trigger an exit when a specified condition is met. A limit order sets a price at which a trader is willing to buy or sell. A stop-limit order combines a trigger with a limit price.

    Can I use a stop-loss when trading crypto futures?

    Many crypto futures platforms offer stop-loss features. However, futures involve additional risks, including leverage and liquidation. Traders should understand the platform’s rules before using them.

    Does a stop-loss guarantee that I will lose only the amount I planned?

    No. Slippage and rapid market movements can result in a larger loss than expected. A stop-limit order may also fail to execute.

    Disclaimer

    This article is for educational purposes only and does not provide financial or investment advice. Cryptocurrency trading involves significant risk, and losses can exceed initial estimates. Always understand your exchange’s order rules before placing a trade.

  • What is a Market Order? A Beginner’s Guide to Crypto Trading

    What is a Market Order? A Beginner’s Guide to Crypto Trading

    Introduction

    When you trade cryptocurrency, you need to choose how you want to buy or sell an asset.

    One of the simplest options is a market order.

    A market order tells the exchange that you want to buy or sell an asset immediately at the best available prices in the market.

    Unlike a limit order, you do not set a specific price for the trade. Instead, the exchange matches your order with available orders in the market.

    As a result, market orders can be useful when getting an immediate execution is more important than choosing an exact price.

    However, the final price may differ from the price you see when placing the order. Therefore, beginners should understand how market orders work before using them.

    What is a Market Order?

    A market order is an instruction to buy or sell an asset at the best available prices when the order reaches the market.

    For example, suppose BTC is trading around 100,000 USDT.

    You want to buy BTC immediately. Instead of entering a specific price, you place a market buy order.

    The exchange then matches your order with available sell orders.

    Therefore, your trade can execute quickly, but the exact execution price is not guaranteed.

    The final price depends on the available orders in the market at that moment.

    How does a Market Order work?

    The process is relatively simple.

    First, you choose the cryptocurrency and trading pair you want to trade.

    Next, you select the market order option.

    Then, you enter the amount you want to buy or sell.

    After that, you submit the order.

    The exchange looks at the available orders on the other side of the market. For a buy order, it matches your order with available sell orders. For a sell order, it matches your order with available buy orders.

    Finally, the exchange completes the trade as matching orders become available.

    Because the market can change quickly, the execution price can vary during this process.

    A Simple Market Order Example

    Imagine the BTC/USDT market currently has these sell orders:

    PriceAvailable BTC
    100,000 USDT0.50 BTC
    100,100 USDT0.30 BTC
    100,200 USDT0.40 BTC

    Now suppose you place a market order to buy 0.70 BTC.

    The first 0.50 BTC may be available at 100,000 USDT.

    However, only 0.20 BTC remains to complete your order. The exchange may therefore match the remaining amount at the next available price of 100,100 USDT.

    As a result, your entire order may not execute at one single price.

    This is one reason why understanding the order book is useful before placing a market order.

    Market Order vs Limit Order

    Market orders and limit orders work differently.

    Market OrderLimit Order
    Aims for immediate executionExecutes only at the specified price or a better price
    Does not set an exact execution priceLets you set the price
    Uses available orders in the marketWaits for matching orders
    Final price can varyPrice is controlled by the order limit
    Can be useful when speed mattersCan be useful when price control matters

    In short, the order focuses on execution, while a limit order focuses on price control.

    However, neither order type guarantees a particular trading outcome.

    What is Slippage?

    Slippage is the difference between the expected price of a trade and the actual execution price.

    For example, you may see BTC at 100,000 USDT and place a market buy order.

    However, if there are not enough sellers at that price, part of your order may execute at higher prices.

    Therefore, your average execution price could be above 100,000 USDT.

    Slippage can become more noticeable when:

    • The market is moving quickly
    • The trading pair has lower liquidity
    • The order is relatively large
    • There are fewer orders near the current price

    For this reason, checking the available market depth can help you understand the conditions before placing a larger order.

    Why Can the Final Price Be Different?

    A market order does not lock in the price shown on your screen.

    Instead, it uses the available orders when the exchange processes the trade.

    Crypto markets can change within seconds. At the same time, traders can place or cancel orders.

    As a result, the available prices may change before your order is fully executed.

    This means the displayed price and the final execution price can sometimes be different.

    Benefits of Market Orders

    Quick Execution

    A market order aims to execute immediately using available orders.

    Therefore, it can be useful when you want to enter or exit a position without waiting for a specific price.

    Simple to Use

    Market orders are straightforward for beginners.

    You only need to select the asset, choose the market order option, and enter the amount.

    Useful in Active Markets

    When a trading pair has strong liquidity, many orders may be available near the current price.

    As a result, market orders may experience less price movement during execution than they might in a market with limited liquidity.

    Risks of Market Orders

    The Price Is Not Fixed

    The biggest point to remember is that a market order does not guarantee an exact execution price.

    Instead, the final price depends on available orders.

    Slippage Can Occur

    If the market has limited liquidity or moves quickly, your order may execute across several price levels.

    Consequently, your average execution price can differ from the price you expected.

    Large Orders Can Affect Execution

    A large order may use several available price levels.

    Therefore, larger trades require more attention to market depth and liquidity.

    When Should Beginners Be Careful?

    Before placing a market order, consider the current market conditions.

    First, check the trading pair and make sure you have selected the correct asset.

    Next, look at the available buy and sell orders.

    Then, consider the size of your order compared with the available market depth.

    Finally, review the amount and trading details before confirming the transaction.

    These simple checks can help reduce avoidable mistakes.

    Common Beginner Mistakes

    Assuming the Displayed Price Is Guaranteed

    The price shown on the trading screen can change quickly.

    Therefore, do not assume that your entire market order will execute at that exact price.

    Ignoring Liquidity

    A trading pair with limited liquidity may have fewer available orders.

    As a result, larger orders can experience greater price differences during execution.

    Placing the Wrong Order

    Always check whether you selected a buy or sell order before confirming the trade.

    Ignoring Order Size

    A small order and a large order can interact with the market differently.

    For this reason, beginners should understand the available market depth before placing larger orders.

    FAQs

    What is a market order in crypto?

    It is an instruction to buy or sell a cryptocurrency at the best available prices when the order is processed.

    Does a market order guarantee a price?

    No. It aims for execution rather than a specific price.

    Can a market order have slippage?

    Yes. Slippage can occur when the available prices change or when there are not enough orders at the expected price.

    Is a market order executed immediately?

    It is designed for immediate execution, but the actual execution process depends on available orders and market conditions.

    What is the difference between a market order and a limit order?

    It prioritizes execution at available prices. A limit order lets you specify the price at which you are willing to buy or sell.

    Can a large market order affect the execution price?

    Yes. A large order may consume available orders at several price levels. As a result, its average execution price can differ from the initial displayed price.

    Disclaimer

    This lesson is for educational purposes only. It does not provide financial, investment, trading, or legal advice.

    Crypto markets can be volatile, and trading involves risk. Therefore, always understand an order type and its potential risks before placing a trade.

  • What is an Order Book? A Beginner’s Guide to Crypto Trading

    When you open a crypto trading platform, you may see a list of buy and sell orders next to the price chart. This list is called an order book.

    It shows the prices at which traders want to buy or sell an asset. As a result, the order book helps you understand the current demand and supply in a market.

    Before placing a trade, it is useful to understand how this list works and what the numbers mean.

    What is an Order Book?

    An order book is a live list of buy and sell orders for a particular trading pair.

    For example, suppose you are looking at the BTC/USDT trading pair.

    The order book may show:

    • Traders who want to buy BTC
    • Traders who want to sell BTC
    • The price of each order
    • The amount traders want to buy or sell

    Depending on the platform, the buy side usually appears below or beside the sell side.

    Meanwhile, traders can place, change, or cancel orders. Therefore, the order book can change quickly.

    In simple terms, an order book gives you a snapshot of buying and selling interest in a market.

    What are Bids?

    A bid is a buy order.

    It shows the price a trader is willing to pay for an asset.

    For example, imagine the BTC/USDT market has these bids:

    Bid PriceAmount
    99,900 USDT0.50 BTC
    99,850 USDT0.80 BTC
    99,800 USDT1.20 BTC

    Here, traders have placed bids at different prices.

    The highest bid is the highest price a buyer currently offers.

    If a seller accepts that price, the two orders can match and a trade can take place.

    What are Asks?

    An ask is a sell order.

    It shows the price at which a trader is willing to sell an asset.

    For example, imagine the order book shows:

    Ask PriceAmount
    100,000 USDT0.40 BTC
    100,050 USDT0.70 BTC
    100,100 USDT1.00 BTC

    In this case, the lowest ask is the lowest price a seller currently offers.

    When a buyer accepts an available ask, the order can be matched and a trade can occur.

    Therefore, bids represent buying interest, while asks represent selling interest.

    What is the Spread?

    The spread is the difference between the highest bid and the lowest ask.

    For example:

    • Highest bid: 99,900 USDT
    • Lowest ask: 100,000 USDT
    • Spread: 100 USDT

    So, the spread is:

    100,000 − 99,900 = 100 USDT

    Generally, a smaller spread means the buy and sell prices are closer together.

    However, spread size can change as market conditions and trading activity change.

    For this reason, the spread you see at one moment may be different a few seconds later.

    What is Market Depth?

    Market depth refers to the number and size of buy and sell orders available at different prices.

    For instance, imagine an order book with many large orders close to the current market price.

    In that situation, this order list has more visible depth around those price levels.

    On the other hand, an order book with fewer available orders may have less visible depth.

    Market depth can help traders understand how much buying and selling interest exists at different prices.

    However, keep in mind that an order can be cancelled before it is executed. Therefore, this order list does not guarantee that every displayed order will remain available.

    How does an Order Book work?

    The process is fairly simple.

    First, a trader places a buy or sell order.

    Next, the order enters the order book if it cannot be matched immediately.

    Then, the exchange looks for a compatible order on the other side.

    For example, a buyer may place an order to buy BTC at 100,000 USDT.

    If a seller is willing to sell BTC at that price, the orders can match.

    Once the trade happens, the matched orders are removed or reduced from the order book.

    As a result,this order list keeps changing as traders place, modify, cancel, and execute orders.

    Order Book vs Price Chart

    An order book and a price chart show different information.

    Order BookPrice Chart
    Shows current buy and sell ordersShows price movement over time
    Shows bids and asksShows historical and current price data
    Helps view available market depthHelps study price trends and patterns
    Can change very quicklyChanges as new price data appears

    Therefore, the two tools can provide different views of the same market.

    A price chart helps you see how the market has moved over time. In contrast, this order list shows available buy and sell interest at that moment.

    Together, they can help you understand different parts of market activity.

    Why is an Order Book important?

    An order book can help traders understand the current structure of a market.

    For example, it can show whether there are many visible orders near a particular price.

    It can also help traders see the current spread between buyers and sellers.

    Furthermore, market depth can provide information about the amount of visible liquidity around different price levels.

    Even so, you should not treat this order list as a prediction tool.

    Orders can change or disappear quickly. In addition, the order book only shows available orders at that moment.

    Therefore, it is better to view this order list as a source of current market information rather than a guarantee of what will happen next.

    What should beginners look for?

    When reading an order book, start with four basic things:

    1. Highest Bid

    First, check the highest price currently offered by buyers.

    2. Lowest Ask

    Next, check the lowest price currently offered by sellers.

    3. Spread

    Then, compare the highest bid with the lowest ask.

    4. Market Depth

    Finally, look at the size and number of orders around different price levels.

    Together, these four points can help beginners understand the basic structure of an order book.

    A Simple Order Book Example

    Suppose the BTC/USDT order book looks like this:

    Sell Orders

    PriceBTC
    100,2000.5
    100,1000.8
    100,0001.0

    Buy Orders

    PriceBTC
    99,9000.7
    99,8001.0
    99,7001.5

    From this example:

    • The lowest ask is 100,000 USDT.
    • The highest bid is 99,900 USDT.
    • The spread is 100 USDT.
    • The displayed orders show visible market depth at these prices.

    If a buyer places an order that matches an available sell order, a trade can occur.

    As more orders are placed or executed, these numbers can change.

    Common Beginner Mistakes

    Confusing the Bid With the Ask

    The easiest way to remember is:

    Bid = Buy

    Ask = Sell

    Assuming Large Orders Cannot Move

    However, large orders can be cancelled or changed before execution.

    Therefore, seeing a large order does not mean that the order will definitely result in a trade.

    Treating the Order Book as a Prediction

    An order book shows current orders. It does not, however, guarantee future price movement.

    Instead, use it to understand the current buying and selling activity.

    Ignoring the Spread

    Finally, remember that the difference between the highest bid and lowest ask can matter when placing trades.

    FAQs

    What is an order book in crypto?

    It is a live list of buy and sell orders for a specific trading pair.

    What is a bid?

    A bid is an order to buy an asset at a specified price.

    What is an ask?

    An ask is an order to sell an asset at a specified price.

    What is the spread in an order book?

    The spread is the difference between the highest bid and the lowest ask.

    What does market depth mean?

    Market depth refers to the amount of buy and sell orders available at different price levels.

    Can an order disappear from the order book?

    Yes. For example, a trader can cancel or change an order before it is executed.

    Does an order book predict the price?

    No. It shows current available orders and market activity. However, it does not guarantee future price movements.

    Disclaimer

    This lesson is for educational purposes only. It does not provide financial, investment, trading, or legal advice.

    Crypto markets can be volatile, and trading involves risk. Therefore, always understand how an order works before placing a trade.