Category: Trading Knowledge

  • Bitcoin Whale Positioning: What Short Bets Mean

    Bitcoin Whale Positioning: What Short Bets Mean

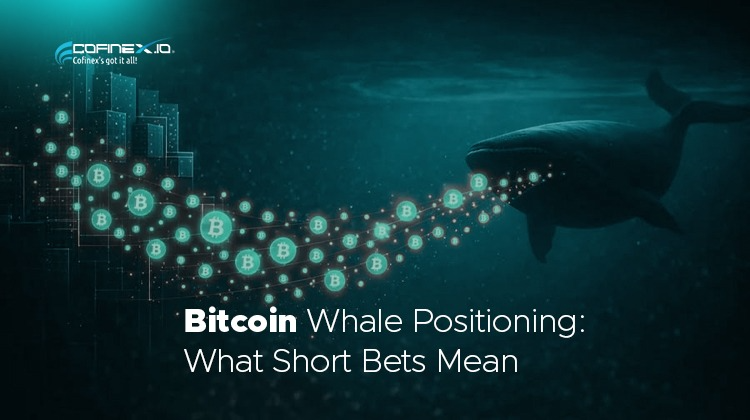
    Bitcoin’s market direction is influenced by many factors, including investor sentiment, liquidity, economic news, and trading activity. One signal that often attracts attention is the positioning of large Bitcoin traders, commonly known as whales.

    Recent reports have highlighted a shift toward net short Bitcoin positions among large traders on Hyperliquid. The development has raised questions about whether these traders expect further price declines or are protecting existing investments.

    However, whale positioning does not predict Bitcoin’s next move with certainty. Some traders use short positions to profit from falling prices, while others use them to hedge against potential losses elsewhere.

    Understanding the difference can help traders interpret market signals without reacting to every headline.

    Who Are Bitcoin Whales?

    Bitcoin whales are individuals, funds, or other entities that hold or control substantial amounts of Bitcoin or maintain large positions in Bitcoin-related markets.

    Their activity can attract attention because large orders may influence liquidity and short-term price movements, especially when the market lacks sufficient buying or selling depth.

    However, not every large trader follows the same strategy. Some focus on long-term holdings, while others trade derivatives, manage portfolios, or hedge exposure to other financial assets.

    It is also important to distinguish between whales who hold Bitcoin directly and large traders who open leveraged positions on derivatives exchanges. Their market exposure and objectives can differ significantly.

    What Does It Mean When Bitcoin Whales Go Short?

    A short position allows a trader to benefit if an asset’s price falls, subject to the product’s structure, fees, and trading costs.

    For example, a trader opens a Bitcoin short position when BTC trades at $80,000. If the price falls to $76,000, the position may generate a profit. If Bitcoin rises instead, the trader may face a loss.

    When reports say whales have turned net short, they mean the tracked group holds more short exposure than long exposure under the data provider’s methodology.

    This does not mean every large trader expects Bitcoin to fall. Some may hold long positions elsewhere, use options to manage risk, or maintain offsetting positions across different platforms.

    Why Are Traders Watching Bitcoin Whale Positions Now?

    Reports published on October 27 and 28, 2026, highlighted a change in the positioning of large traders on Hyperliquid. Data attributed to Glassnode showed the tracked group moving to net short Bitcoin exposure for the first time since March. <Cite refs={[“turn655201search1″,”turn655201search4”]}/>

    The shift matters because large traders can influence market sentiment. However, the data represents a particular group of traders on a particular platform, not the entire Bitcoin market.

    Other indicators can tell a different story. For example, a report on October 27 described options positioning that suggested some traders were still showing interest in upside exposure, despite the bearish tilt in large traders’ positions. <Cite refs={[“turn655201search1″,”turn655201search7”]}/>

    This difference shows why traders should examine whale positioning alongside other evidence before drawing conclusions.

    Does Whale Shorting Mean Bitcoin Will Fall?

    Not necessarily. A large short position can reflect several different strategies.

    1. A Bearish Market View

    Some traders open short positions because they expect Bitcoin’s price to decline. They may base that view on weakening momentum, selling pressure, economic uncertainty, or other market signals.

    If enough traders share that view, their activity can add to negative sentiment. However, a bearish position does not guarantee that the market will move in their favour.

    2. Hedging Existing Investments

    A trader may hold Bitcoin or other crypto assets while opening a short position to reduce potential losses.

    For example, an investor holding a substantial amount of spot Bitcoin could short BTC futures to offset some of the risk if prices fall. The short position might lose money if Bitcoin rises, but the spot holdings could gain value.

    In this case, the trader is managing exposure rather than making a straightforward bet against Bitcoin.

    3. Short-Term Trading

    Large traders may open short positions to take advantage of temporary price movements, technical patterns, or changes in derivatives funding rates.

    These positions can change quickly. A trader who opens a large short today may close it within hours if market conditions shift.

    Consequently, one snapshot of whale positioning may not reflect a trader’s longer-term expectations.

    What Is a Short Squeeze, and Why Does It Matter?

    A short squeeze can occur when an asset’s price rises sharply and forces short sellers to close their positions.

    Short sellers may close positions by buying back the asset or its equivalent exposure. When many traders do this at the same time, their buying activity can push prices higher and force additional short sellers to exit.

    This can create a rapid upward move even when market sentiment initially appears bearish.

    For example, if several large traders short Bitcoin near $80,000 and BTC unexpectedly climbs, some may close their positions to limit losses. Their buying can add to the upward pressure.

    However, a short squeeze is only one possible outcome. Bitcoin could also fall if selling pressure strengthens. Whale positioning alone cannot determine which scenario will occur.

    Which Indicators Should Traders Watch Alongside Whale Positions?

    Rather than relying on a single signal, traders can compare several indicators to understand the broader market.

    Bitcoin price action: Observe whether BTC is making higher highs, lower lows, or trading within a range. Price behaviour helps put derivatives data into context.

    Open interest: This measures the total outstanding positions in derivatives markets. Rising open interest can indicate that more positions are entering the market, but it does not reveal the direction of all those positions by itself.

    Funding rates: Perpetual futures exchanges use funding payments to help keep contract prices aligned with spot prices. Funding rates can provide clues about positioning imbalances, although their interpretation depends on the exchange and market conditions.

    Liquidations: Forced closures of leveraged positions can accelerate price movements. A sharp rise in liquidations may indicate that crowded positions are unwinding.

    Spot market activity: Trading volume and demand in spot markets can help traders assess whether price movements have broad participation.

    ETF flows and macroeconomic developments: Investment flows and economic announcements can influence Bitcoin demand and market sentiment. Traders should compare these factors with derivatives positioning rather than assume one signal explains the entire market.

    Together, these indicators offer a more balanced view of market conditions.

    What Are the Risks of Following Whale Trades?

    Tracking large traders can provide useful context, but copying their positions carries risks.

    • Incomplete information: Public data may not show a trader’s positions across every exchange, wallet, or financial product.
    • Different objectives: A whale may be hedging a large portfolio rather than expressing a bearish view.
    • Changing positions: Large traders can close or reverse trades before other market participants react.
    • Leverage risk: A trader who copies a leveraged position may face liquidation even if the original trader has more capital or a different risk strategy.
    • Market volatility: Bitcoin can move sharply in either direction, causing losses for both long and short traders.

    The size of a position also does not reveal the trader’s full financial situation, risk limits, or reasons for entering the trade.

    For these reasons, whale data works best as one part of market analysis, not as a standalone trading signal.

    Final Thoughts

    Bitcoin whale positioning can offer insight into how some large traders are approaching the market. Recent reports of net short positioning on Hyperliquid have attracted attention, but they do not establish that Bitcoin will decline.

    A short position may reflect a bearish view, a hedge, or a temporary trading strategy. Meanwhile, price action, derivatives activity, spot demand, and broader economic conditions can provide additional context.

    For traders, the key lesson is simple: understand what the data measures before interpreting what it means. Following market positioning without considering its limitations can lead to decisions based on incomplete information.

    This article is for educational purposes only and does not constitute financial or investment advice.

    Follow Cofinex

    Telegram: https://t.me/cofinexofficial

    X (Twitter): https://x.com/CofinexExchange

    Facebook: https://www.facebook.com/

    Instagram: https://www.instagram.com/cofinexexchange/

    LinkedIn: https://in.linkedin.com/company/cofinexexchange

    WhatsApp Channel: https://whatsapp.com/channel/0029VbBSQtJ2P59lfbaRXJ2k
    YouTube: https://www.youtube.com/@cofinexexchange

  • XRP Resistance Levels: Key Zones Traders Watch

    XRP Resistance Levels: Key Zones Traders Watch

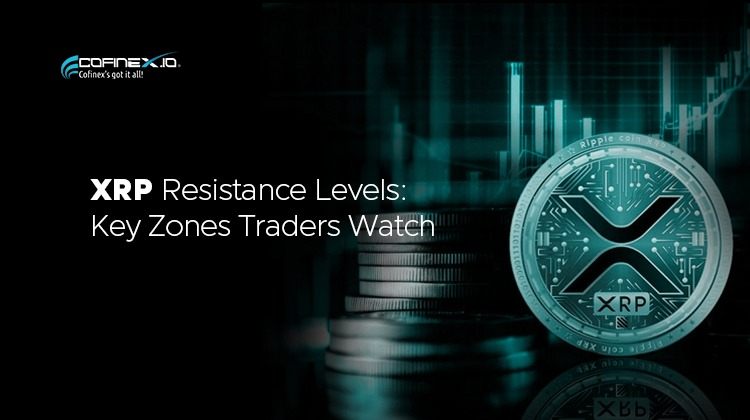
    XRP traders often watch support and resistance levels to understand where buying or selling pressure may increase. These levels can help traders interpret price movements, plan trades, and identify potential breakouts or reversals.

    However, support and resistance do not guarantee what XRP will do next. The price can break through either level when market sentiment changes, trading volume increases, or major news affects the crypto market.

    In this guide, we explain how XRP support and resistance work, how traders identify these zones, and what signals they watch before making trading decisions.

    What Are XRP Support and Resistance Levels?

    Support and resistance are price zones that traders use to study market behaviour.

    Support is an area where buying interest may increase as the price falls. Buyers may see the asset as attractive at that level, which can slow a decline or trigger a rebound.

    Resistance is an area where selling pressure may increase as the price rises. Some traders may sell to secure profits, while others may open short positions or avoid buying at higher prices.

    These levels are not fixed barriers. They reflect previous market activity and can change as new trading data emerges.

    Why Do Traders Watch XRP Resistance Levels?

    Resistance levels can help traders understand whether XRP faces selling pressure or has enough buying interest to move higher.

    Traders commonly watch resistance for three reasons:

    1. To Identify Potential Breakouts

    A breakout occurs when XRP moves above a resistance zone. Some traders interpret this move as a sign that buying pressure has strengthened.

    However, a brief move above resistance does not always confirm a breakout. Traders may wait for a candle close above the zone, stronger trading volume, or a successful retest before assessing whether the move has momentum.

    2. To Understand Selling Pressure

    If XRP repeatedly struggles to move above the same zone, traders may interpret that behaviour as evidence of selling pressure.

    Still, repeated tests can lead to different outcomes. Sellers may continue to defend the level, or buyers may eventually push through it.

    3. To Plan Risk Management

    Traders can use resistance zones when planning entry points, profit targets, and stop-loss orders. They may also compare the potential reward of a trade with the amount they could lose if the price moves against them.

    These levels should support a trading plan, not replace risk management.

    How Do Traders Identify XRP Support and Resistance?

    Traders use several technical tools to identify important price zones.

    Previous Highs and Lows

    Previous swing highs can act as resistance because sellers entered the market around those prices in the past. Previous swing lows may act as support because buyers showed interest there.

    These levels can become more relevant when XRP approaches them again and traders respond in a similar way.

    Trading Volume

    Volume shows how much XRP traders buy and sell over a particular period.

    A breakout accompanied by rising volume may indicate stronger participation than a breakout on weak volume. However, volume alone cannot confirm the direction of the next move.

    Moving Averages

    Moving averages smooth out price data and help traders study trends. Some traders watch the 50-day and 200-day moving averages as potential dynamic support or resistance.

    Unlike fixed horizontal levels, moving averages change as new price data enters the calculation.

    Trendlines and Chart Patterns

    Trendlines connect a series of price highs or lows. Traders use them to study whether XRP follows an upward, downward, or sideways pattern.

    Chart patterns can also highlight areas where buying and selling pressure may shift. However, no pattern guarantees a particular outcome.

    XRP Support and Resistance: A Current Market Snapshot

    Technical levels change as XRP moves. On October 28, 2026, one technical analysis source identified the following near-term zones on its daily chart:

    LevelIllustrative price zone
    First resistance$1.345
    Second resistance$1.366
    First support$1.3145
    Second support$1.2925

    These levels represent one provider’s technical calculations at the time of publication, not universal market levels. Other chart providers may calculate different zones depending on their data, timeframe, and methodology.

    Traders should check an updated XRP chart before using any price level. A zone that matters on an hourly chart may not carry the same significance on a daily or weekly chart.

    What Happens When XRP Breaks Resistance?

    When XRP moves above resistance, traders often watch what happens next rather than assuming the price will continue rising.

    Three possible scenarios deserve attention:

    A confirmed breakout: XRP closes above resistance, trading activity strengthens, and the price remains above the zone. A combination of these signals may indicate improving momentum.

    A false breakout: XRP briefly moves above resistance but quickly falls back below it. This can happen when buyers fail to sustain the move or sellers return to the market.

    A resistance retest: After breaking above resistance, XRP returns to test the same zone. If buyers defend it, the former resistance may begin acting as support. However, the retest can also fail.

    These scenarios help traders organise their analysis, but they do not predict the outcome with certainty.

    What If XRP Falls Below Support?

    A support break may signal that buyers are struggling to defend a particular price zone.

    If XRP breaks below support, the next lower price zone, previous swing lows, and trading volume may become important.

    However, a temporary move below support does not always lead to a sustained decline. XRP may recover the level quickly, especially during periods of high volatility.

    Stop-loss orders can also experience slippage during fast market moves, meaning execution may occur at a different price from the requested level.

    For this reason, traders should avoid treating any support level as a guaranteed price floor.

    What Can Move XRP Beyond Technical Levels?

    Technical analysis provides only one part of the picture. Several external factors can influence XRP’s price and cause it to break through established zones.

    • Bitcoin’s direction: Large moves in Bitcoin can influence sentiment across the wider crypto market.
    • Market liquidity: Thin liquidity can make prices move more sharply when large orders enter the market.
    • Economic announcements: Interest-rate decisions, inflation data, and changes in the U.S. dollar can affect demand for risk-sensitive assets.
    • XRP-related developments: News involving Ripple, regulatory matters, or XRP-related investment products can influence market expectations.
    • Leverage and liquidations: Forced position closures can increase buying or selling pressure and accelerate price movements.

    Alongside technical levels, traders should also consider broader market conditions rather than relying on a single indicator.

    Final Thoughts

    XRP resistance levels can help traders understand where selling pressure may emerge, while support levels can highlight areas where buyers may become more active.

    Previous highs and lows, trading volume, moving averages, and trendlines can all help identify these zones. Traders can then watch for breakouts, failed moves, and retests to assess changing market conditions.

    However, support and resistance remain analytical tools, not guarantees. XRP can move beyond these levels when market conditions change.

    A disciplined approach combines technical analysis with current market information, clear risk management, and an understanding that cryptocurrency prices can change quickly.

    This article is for educational purposes only and does not constitute financial or investment advice.

    Follow Cofinex

    Telegram: https://t.me/cofinexofficial

    X (Twitter): https://x.com/CofinexExchange

    Facebook: https://www.facebook.com/

    Instagram: https://www.instagram.com/cofinexexchange/

    LinkedIn: https://in.linkedin.com/company/cofinexexchange

    WhatsApp Channel: https://whatsapp.com/channel/0029VbBSQtJ2P59lfbaRXJ2k
    YouTube: https://www.youtube.com/@cofinexexchange

    XRP traders often watch support and resistance levels to understand where buying or selling pressure may increase. These levels can help traders interpret price movements, plan trades, and identify potential breakouts or reversals.

    However, support and resistance do not guarantee what XRP will do next. The price can break through either level when market sentiment changes, trading volume increases, or major news affects the crypto market.

    In this guide, we explain how XRP support and resistance work, how traders identify these zones, and what signals they watch before making trading decisions.

    What Are XRP Support and Resistance Levels?

    Support and resistance are price zones that traders use to study market behaviour.

    Support is an area where buying interest may increase as the price falls. Buyers may see the asset as attractive at that level, which can slow a decline or trigger a rebound.

    Resistance is an area where selling pressure may increase as the price rises. Some traders may sell to secure profits, while others may open short positions or avoid buying at higher prices.

    These levels are not fixed barriers. They reflect previous market activity and can change as new trading data emerges.

    Why Do Traders Watch XRP Resistance Levels?

    Resistance levels can help traders understand whether XRP faces selling pressure or has enough buying interest to move higher.

    Traders commonly watch resistance for three reasons:

    1. To Identify Potential Breakouts

    A breakout occurs when XRP moves above a resistance zone. Some traders interpret this move as a sign that buying pressure has strengthened.

    However, a brief move above resistance does not always confirm a breakout. Traders may wait for a candle close above the zone, stronger trading volume, or a successful retest before assessing whether the move has momentum.

    2. To Understand Selling Pressure

    If XRP repeatedly struggles to move above the same zone, traders may interpret that behaviour as evidence of selling pressure.

    Still, repeated tests can lead to different outcomes. Sellers may continue to defend the level, or buyers may eventually push through it.

    3. To Plan Risk Management

    Traders can use resistance zones when planning entry points, profit targets, and stop-loss orders. They may also compare the potential reward of a trade with the amount they could lose if the price moves against them.

    These levels should support a trading plan, not replace risk management.

    How Do Traders Identify XRP Support and Resistance?

    Traders use several technical tools to identify important price zones.

    Previous Highs and Lows

    Previous swing highs can act as resistance because sellers entered the market around those prices in the past. Previous swing lows may act as support because buyers showed interest there.

    These levels can become more relevant when XRP approaches them again and traders respond in a similar way.

    Trading Volume

    Volume shows how much XRP traders buy and sell over a particular period.

    A breakout accompanied by rising volume may indicate stronger participation than a breakout on weak volume. However, volume alone cannot confirm the direction of the next move.

    Moving Averages

    Moving averages smooth out price data and help traders study trends. Some traders watch the 50-day and 200-day moving averages as potential dynamic support or resistance.

    Unlike fixed horizontal levels, moving averages change as new price data enters the calculation.

    Trendlines and Chart Patterns

    Trendlines connect a series of price highs or lows. Traders use them to study whether XRP follows an upward, downward, or sideways pattern.

    Chart patterns can also highlight areas where buying and selling pressure may shift. However, no pattern guarantees a particular outcome.

    XRP Support and Resistance: A Current Market Snapshot

    Technical levels change as XRP moves. On October 28, 2026, one technical analysis source identified the following near-term zones on its daily chart:

    LevelIllustrative price zone
    First resistance$1.345
    Second resistance$1.366
    First support$1.3145
    Second support$1.2925

    These levels represent one provider’s technical calculations at the time of publication, not universal market levels. Other chart providers may calculate different zones depending on their data, timeframe, and methodology.

    Traders should check an updated XRP chart before using any price level. A zone that matters on an hourly chart may not carry the same significance on a daily or weekly chart.

    What Happens When XRP Breaks Resistance?

    When XRP moves above resistance, traders often watch what happens next rather than assuming the price will continue rising.

    Three possible scenarios deserve attention:

    A confirmed breakout: XRP closes above resistance, trading activity strengthens, and the price remains above the zone. A combination of these signals may indicate improving momentum.

    A false breakout: XRP briefly moves above resistance but quickly falls back below it. This can happen when buyers fail to sustain the move or sellers return to the market.

    A resistance retest: After breaking above resistance, XRP returns to test the same zone. If buyers defend it, the former resistance may begin acting as support. However, the retest can also fail.

    These scenarios help traders organise their analysis, but they do not predict the outcome with certainty.

    What If XRP Falls Below Support?

    A support break may signal that buyers are struggling to defend a particular price zone.

    If XRP breaks below support, the next lower price zone, previous swing lows, and trading volume may become important.

    However, a temporary move below support does not always lead to a sustained decline. XRP may recover the level quickly, especially during periods of high volatility.

    Stop-loss orders can also experience slippage during fast market moves, meaning execution may occur at a different price from the requested level.

    For this reason, traders should avoid treating any support level as a guaranteed price floor.

    What Can Move XRP Beyond Technical Levels?

    Technical analysis provides only one part of the picture. Several external factors can influence XRP’s price and cause it to break through established zones.

    • Bitcoin’s direction: Large moves in Bitcoin can influence sentiment across the wider crypto market.
    • Market liquidity: Thin liquidity can make prices move more sharply when large orders enter the market.
    • Economic announcements: Interest-rate decisions, inflation data, and changes in the U.S. dollar can affect demand for risk-sensitive assets.
    • XRP-related developments: News involving Ripple, regulatory matters, or XRP-related investment products can influence market expectations.
    • Leverage and liquidations: Forced position closures can increase buying or selling pressure and accelerate price movements.

    Alongside technical levels, traders should also consider broader market conditions rather than relying on a single indicator.

    Final Thoughts

    XRP resistance levels can help traders understand where selling pressure may emerge, while support levels can highlight areas where buyers may become more active.

    Previous highs and lows, trading volume, moving averages, and trendlines can all help identify these zones. Traders can then watch for breakouts, failed moves, and retests to assess changing market conditions.

    However, support and resistance remain analytical tools, not guarantees. XRP can move beyond these levels when market conditions change.

    A disciplined approach combines technical analysis with current market information, clear risk management, and an understanding that cryptocurrency prices can change quickly.

    This article is for educational purposes only and does not constitute financial or investment advice.

    Follow Cofinex

    Telegram: https://t.me/cofinexofficial

    X (Twitter): https://x.com/CofinexExchange

    Facebook: https://www.facebook.com/

    Instagram: https://www.instagram.com/cofinexexchange/

    LinkedIn: https://in.linkedin.com/company/cofinexexchange

    WhatsApp Channel: https://whatsapp.com/channel/0029VbBSQtJ2P59lfbaRXJ2k
    YouTube: https://www.youtube.com/@cofinexexchange

  • Open Interest vs Trading Volume

    Open Interest vs Trading Volume

    Introduction

    When you explore cryptocurrency futures trading, you may come across two important terms: Open Interest and Trading Volume.

    Both indicators help traders understand market activity. However, they measure different things.

    Trading volume shows how much trading has taken place during a specific period. Open interest shows how many derivative contracts remain open and unsettled.

    Understanding the difference can help you read market activity, identify changes in trader participation, and make better sense of crypto futures data.

    Let’s break down how these indicators work and how traders use them.

    What is Open Interest in crypto?

    Open Interest (OI) refers to the total number of outstanding derivative contracts that have not yet been closed, settled, or expired.

    In crypto markets, traders commonly use this indicator when analysing futures and perpetual contracts.

    For example, imagine two traders enter a Bitcoin futures contract:

    • Trader A opens a long position.
    • Trader B opens a short position.

    One contract is now open in the market. Therefore, open interest increases by one contract.

    If both traders later close their positions, that contract is no longer outstanding, so open interest decreases by one.

    Important: Open interest counts each outstanding contract once. It does not count the long and short sides as two separate contracts.

    What does Rising or Falling Open Interest mean?

    Changes in open interest can provide clues about market participation.

    Rising Open Interest

    When open interest increases, it generally means more derivative contracts are being opened than closed.

    This may indicate:

    • More traders are entering the market.
    • Existing participants are increasing their positions.
    • Leverage and exposure in the market are growing.

    However, rising open interest does not automatically mean the market is bullish. Every futures contract has both a long and a short side.

    Falling Open Interest

    When open interest decreases, it generally means more contracts are being closed or settled than opened.

    This may indicate:

    • Traders are closing existing positions.
    • Market participation is declining.
    • Positions are being reduced after a major price movement.

    A decline in OI does not necessarily mean traders expect prices to fall. Both long and short positions can be closed.

    What is Trading Volume in crypto?

    Trading volume measures the total amount of an asset or the number of contracts traded during a specific period.

    For example, suppose Bitcoin futures record 10,000 contracts traded in one hour. The trading volume for that period is 10,000 contracts, based on a contract-count measurement.

    Volume can increase when traders actively open and close positions.

    It helps show how much trading activity is taking place in the market.

    What does High or Low Trading Volume mean?

    High Trading Volume

    High volume indicates increased trading activity during the selected period.

    It may suggest:

    • More buying and selling activity.
    • Greater market participation.
    • Stronger interest in a particular asset.
    • Increased activity during a price breakout or major market event.

    However, high volume alone does not confirm whether prices will rise or fall.

    Low Trading Volume

    Low volume indicates less trading activity during the selected period.

    It may suggest:

    • Lower market participation.
    • Reduced interest in an asset.
    • Limited trading activity during a particular session.

    Low volume can also make it harder to execute large orders without affecting the market price, depending on available liquidity.

    Open Interest vs Trading Volume: Key Differences

    Although both indicators measure market activity, they answer different questions.

    FeatureOpen InterestTrading Volume
    MeaningTotal outstanding contractsTotal contracts or asset amount traded during a period
    MeasuresOpen positionsTrading activity
    Time referenceCurrent outstanding position countSelected period, such as 1 hour or 24 hours
    Increases whenNew contracts are openedMore trades take place
    Decreases whenContracts are closed, settled, or expiredTrading activity is lower than in a comparison period
    Common useUnderstanding participation and outstanding exposureUnderstanding market activity and interest

    In simple terms:

    • Open Interest: How many derivative contracts remain open?
    • Trading Volume: How much trading has happened?

    How to read Open Interest and Trading Volume together?

    Looking at both indicators together can provide more context than studying either one alone.

    Here are four common combinations traders analyse.

    1. Price Up + Open Interest Up

    When the price rises alongside increasing open interest, it may suggest that new positions are being added as the market moves higher.

    Some traders interpret this as growing participation in the upward move.

    However, it does not prove that new positions are predominantly bullish. Every open contract has both a long and a short side.

    2. Price Down + Open Interest Up

    When the price falls while open interest increases, new contracts may be entering the market during the downward movement.

    This can indicate increased participation during a decline.

    It does not necessarily mean every new participant is taking a short position.

    3. Price Up + Open Interest Down

    When prices rise while open interest falls, traders may be closing existing positions during the upward move.

    One possible explanation is short covering, where traders close short positions by buying back contracts.

    However, OI and price alone cannot confirm that short covering is the only reason.

    4. Price Down + Open Interest Down

    When both price and open interest decline, traders may be closing positions during the downward movement.

    Long liquidations or position reductions can contribute to this pattern, although the indicators alone cannot identify exactly who is closing positions.

    A Simple Example

    Imagine a Bitcoin futures market with the following activity:

    Market ActivityOpen InterestTrading Volume
    Starting point5,000 contracts—
    New contracts opened5,500 contracts1,000 contracts traded
    More trading activity5,500 contracts2,500 contracts traded
    Existing contracts closed5,200 contracts3,000 contracts traded

    What can you understand?

    • Open interest increased from 5,000 to 5,500 when more contracts were opened than closed.
    • Trading volume increased as more contracts were traded during the period.
    • Later, open interest declined to 5,200 as more contracts were closed than opened.

    Notice that trading volume can remain high even when open interest falls. This happens because traders can actively trade and close existing positions without adding to the total number of outstanding contracts.

    Why do crypto traders monitor these indicators?

    Open interest and trading volume are commonly used in futures market analysis.

    Here are four reasons traders pay attention to them.

    1. Understanding Market Participation

    Open interest helps traders understand whether outstanding derivative positions are increasing or decreasing.

    Trading volume shows whether market activity is rising or slowing down.

    2. Studying Price Breakouts

    When a cryptocurrency moves above resistance or below support, traders may check volume to understand how much trading activity supports that movement.

    They may also monitor open interest to see whether outstanding futures positions are increasing.

    Neither indicator guarantees that a breakout will continue.

    3. Identifying Possible Liquidation Activity

    A sudden decline in open interest during a sharp price movement may be associated with positions being closed or liquidated.

    However, open interest alone cannot tell you how many positions were liquidated. Traders should also examine liquidation data.

    4. Understanding Market Conditions

    Combining price, open interest, volume, and funding rates can provide a broader picture of derivatives market activity.

    This helps traders avoid making decisions based on a single indicator.

    Common Mistakes Beginners Should Avoid

    Before using these indicators, remember a few important points:

    1. Assuming rising open interest means bullish sentiment: Every futures contract has a long and a short side. Increasing OI does not reveal which side is stronger.

    2. Confusing volume with open interest: Volume measures trading activity over a period, while OI measures outstanding contracts.

    3. Treating high volume as a guaranteed breakout signal: High volume can occur during both upward and downward price movements.

    4. Ignoring the timeframe: Always check whether the data represents one hour, 24 hours, or another period.

    5. Relying on one indicator: Combine these metrics with price action, liquidity, funding rates, and risk management.

    Frequently Asked Questions (FAQs)

    1. Is open interest the same as trading volume?

    No. Open interest measures outstanding derivative contracts, while trading volume measures the number of contracts or amount traded during a specific period.

    2. What happens when open interest increases?

    Open interest increases when more contracts are opened than closed, settled, or expired. It generally indicates an increase in outstanding market positions.

    3. Does high trading volume mean the price will increase?

    No. High trading volume indicates increased trading activity. It can occur during both upward and downward price movements.

    4. Can open interest decrease while trading volume increases?

    Yes. Traders may actively trade and close existing positions. As a result, trading volume can rise while the total number of outstanding contracts falls.

    5. Why is open interest important in crypto futures?

    It helps traders understand how many futures contracts remain open. When combined with price and volume data, it can provide additional insight into market participation.

    6. Is open interest useful for spot trading?

    Open interest is primarily used for derivatives such as futures and options. Spot markets generally do not have open interest in the same sense because buying an asset does not create an outstanding derivative contract.

    Disclaimer: This article is for educational purposes only and does not provide financial or investment advice. Cryptocurrency derivatives involve significant risks, including leverage and liquidation. Always conduct your own research before trading.

  • FOMO and FUD in Crypto Trading: How Emotions Affect Traders

    FOMO and FUD in Crypto Trading: How Emotions Affect Traders

    What is FOMO in Crypto Trading?

    FOMO stands for Fear of Missing Out. It happens when traders feel pressured to buy a cryptocurrency because its price is rising or other people are making profits from it.

    For example, imagine Bitcoin is rising quickly. You see posts on social media celebrating the price movement, and people are talking about how much money they have made.

    You may start thinking:

    • What if the price keeps rising?
    • What if I miss this opportunity?
    • Should I buy before it becomes more expensive?

    As a result, you might buy without checking the market conditions or considering the risks.

    This is FOMO.

    How FOMO Affects Trading Decisions

    FOMO can lead to several common trading mistakes:

    1. Buying at the wrong time

    Traders may enter a position after a major price increase because they fear missing further gains. However, the market could correct soon after they buy.

    2. Ignoring research

    Instead of checking a project’s fundamentals, trading volume, liquidity, or market conditions, traders may follow social media trends or popular opinions.

    3. Taking unnecessary risks

    Some traders invest more money than they can afford to lose because they believe the opportunity will disappear quickly.

    4. Chasing every market trend

    When one cryptocurrency rises, traders may quickly move their attention to another trending asset. This can lead to impulsive decisions and an unclear trading strategy.

    What is FUD in Crypto Trading?

    FUD stands for Fear, Uncertainty, and Doubt. It describes negative information, rumours, or opinions that create fear and uncertainty around a cryptocurrency, project, or the wider market.

    FUD can come from different sources, including:

    • Negative news reports.
    • Unverified social media posts.
    • Rumours about a crypto project.
    • Concerns about regulations.
    • Security incidents or exchange-related news.

    For example, imagine you hold a cryptocurrency and suddenly see a post claiming that the project is shutting down. You become worried and decide to sell immediately.

    Later, you discover that the information was misleading or completely false.

    This is how FUD can influence trading decisions.

    However, not all negative information is false. Genuine security issues, regulatory developments, or project failures can affect the market. Therefore, traders should verify information rather than dismiss every negative report as FUD.

    How FUD Affects Trading Decisions

    1. Panic selling

    Traders may sell their holdings quickly because they fear further losses, even when they have not verified the information.

    2. Making decisions based on rumours

    Unconfirmed reports can create unnecessary panic and lead to poor trading choices.

    3. Losing confidence in a strategy

    Constant negative news may cause traders to abandon their original plan without reviewing whether the reasons behind it have actually changed.

    4. Overreacting to market movements

    A sudden price drop can create fear. However, one price movement does not always tell the complete story of a cryptocurrency or project.

    FOMO vs FUD: What is the Difference?

    Although FOMO and FUD create different emotional reactions, both can push traders towards impulsive decisions.

    FOMOFUD
    Fear of missing an opportunityFear caused by uncertainty or negative information
    Often appears during rising markets or trendsOften appears during negative news or falling markets
    Can lead to rushed buyingCan lead to panic selling
    Driven by excitement and social pressureDriven by worry and uncertainty
    Encourages chasing price movementsEncourages reacting to negative information

    The common problem: Both can make traders act before they properly understand the situation.

    Real-Life Example: How FOMO and FUD Work

    Consider a cryptocurrency trading at ₹100.

    Stage 1: FOMO enters the market

    The price rises to ₹130. Social media discussions become increasingly positive, and traders start sharing their profits.

    A trader who missed the initial movement becomes worried about missing further gains. They buy at ₹130 without checking whether the price increase is supported by market activity.

    Stage 2: FUD spreads

    Soon after, an unverified rumour appears claiming that the project has security problems. The price falls to ₹110.

    The trader becomes nervous and sells immediately.

    Stage 3: The emotional decision

    The trader bought because of excitement and sold because of fear. They did not follow a clear trading plan or verify the information before making either decision.

    This example shows how emotions can influence decisions at both ends of a trade.

    How to Avoid FOMO and FUD in Crypto Trading?

    You cannot completely remove emotions from trading. However, you can build habits that prevent emotions from controlling your decisions.

    1. Create a Trading Plan

    Before entering a trade, decide your entry price, exit strategy, stop-loss level, and the amount you are willing to risk.

    A clear plan gives you something to follow when the market becomes unpredictable.

    2. Do Your Own Research

    Do not buy or sell a cryptocurrency simply because someone recommends it online.

    Instead, check reliable sources, project information, market activity, and relevant announcements before making a decision.

    3. Avoid Chasing Sudden Price Movements

    A rapidly rising price does not automatically mean that an asset is a good buying opportunity.

    Similarly, a sudden drop does not always mean that you should sell immediately. Take time to understand what is driving the movement.

    4. Manage Your Risk

    Never risk money you cannot afford to lose. Decide how much capital you are comfortable putting into a trade and avoid increasing your position just because of excitement or fear.

    5. Take a Break When Emotions Take Over

    If you feel pressured to buy or sell immediately, pause before acting.

    Step away from the trading screen, review your plan, and check whether your decision is based on reliable information.

    Common Mistakes Traders Should Avoid

    • Buying a cryptocurrency only because it is trending.
    • Selling immediately after reading an unverified rumour.
    • Following influencers without checking their claims.
    • Increasing trade size because of excitement.
    • Ignoring stop-loss and risk management.
    • Making repeated trades to recover previous losses.

    Remember, not every market movement requires a reaction. Sometimes, waiting and gathering more information is the better decision.

    Frequently Asked Questions (FAQs)

    1. What does FOMO mean in crypto?

    FOMO means Fear of Missing Out. It happens when traders buy a cryptocurrency because they fear missing a potential price increase or profit opportunity.

    2. What does FUD mean in cryptocurrency?

    FUD stands for Fear, Uncertainty, and Doubt. It refers to negative information, rumours, or opinions that create concern about a cryptocurrency or the market.

    3. Is FOMO always bad in trading?

    FOMO is a natural emotional response. However, acting on it without research or a trading plan can lead to poor decisions and unnecessary risks.

    4. How can beginners avoid FOMO and FUD?

    Beginners can reduce their influence by researching before trading, verifying news, following a trading plan, managing risk, and avoiding impulsive decisions.

    5. Can FUD affect cryptocurrency prices?

    Yes. Negative news, rumours, and uncertainty can influence market sentiment and contribute to buying or selling pressure. However, actual price movements depend on several market factors.

    Disclaimer: This article is for educational purposes only. It does not provide financial or investment advice. Cryptocurrency trading involves risk, and readers should conduct their own research before making financial decisions.

  • Risk-Reward Ratio Explained: A Beginner’s Trading Guide

    Introduction

    Every crypto trade involves uncertainty. Prices can move in your favour, but they can also move against you. Therefore, traders need a clear plan for managing potential losses and evaluating possible returns.

    One useful concept is the risk-reward ratio. It helps traders compare how much they are willing to risk on a trade with how much they expect to gain if the trade goes as planned.

    For example, if you are willing to risk ₹100 to potentially earn ₹300, your risk-reward ratio is 1:3.

    However, a higher risk-reward ratio does not guarantee profits. Traders must also consider their win rate, trading costs, market conditions, and execution.

    In this lesson, you will learn what the risk-reward ratio means, how to calculate it, and how traders use it when planning crypto trades.

    What Is the Risk-Reward Ratio?

    The risk-reward ratio compares the potential loss of a trade with its potential profit.

    • Risk: The amount you may lose if the trade reaches your planned stop-loss level.
    • Reward: The amount you may gain if the trade reaches your planned target.

    Traders commonly express this ratio as 1:2, 1:3, or 1:4.

    For example, a 1:2 risk-reward ratio means you are planning to risk ₹1 for a potential reward of ₹2.

    This calculation helps traders evaluate whether a trade offers a reasonable potential reward relative to its planned risk.

    How to Calculate the Risk-Reward Ratio

    You can calculate the risk-reward ratio using a simple formula:

    Risk-Reward Ratio = Potential Loss ÷ Potential Profit

    Let’s understand this with an example.

    Imagine you plan to buy a cryptocurrency at ₹500.

    • Entry price: ₹500
    • Stop-loss price: ₹480
    • Target price: ₹560

    Your potential risk per unit is:

    ₹500 − ₹480 = ₹20

    Your potential reward per unit is:

    ₹560 − ₹500 = ₹60

    Therefore:

    ₹20 ÷ ₹60 = 1:3

    This means you are risking ₹20 for a potential gain of ₹60.

    The trade has a planned risk-reward ratio of 1:3.

    This example excludes trading fees, slippage, funding payments, and other costs. Actual results may differ.

    Common Risk-Reward Ratios Explained

    Traders use different ratios depending on their strategies, market conditions, and trading objectives.

    Risk-Reward RatioAmount RiskedPotential Reward
    1:1₹100₹100
    1:2₹100₹200
    1:3₹100₹300
    1:4₹100₹400
    1:5₹100₹500

    For example, a 1:3 ratio means the potential reward is three times the planned risk.

    However, a higher ratio is not automatically better. A very distant profit target may be less likely to get reached. Therefore, traders should consider realistic price targets rather than choosing a ratio simply because it looks attractive.

    Why Is the Risk-Reward Ratio Important?

    The risk-reward ratio helps traders make more structured decisions before entering a trade.

    1. Helps Evaluate Potential Trades

    Before opening a position, traders can compare the possible loss with the expected gain.

    For instance, if a trade offers a potential reward of ₹100 but requires risking ₹200, a trader may decide that the setup does not meet their trading plan.

    2. Encourages Better Risk Management

    A predefined risk-reward ratio encourages traders to identify their entry, stop-loss, and target levels in advance.

    As a result, they can avoid making decisions based only on emotions or sudden market movements.

    3. Helps Understand the Required Win Rate

    Your win rate is the percentage of trades that close with a profit.

    The risk-reward ratio and win rate work together to determine whether a trading strategy can be profitable over time.

    For example, a trader using a 1:2 ratio does not necessarily need to win every trade to achieve a positive result.

    However, trading fees and losses must also be considered.

    4. Reduces Impulsive Decisions

    Having a predefined target and stop-loss can help traders avoid changing their plans because of fear, greed, or market excitement.

    Nevertheless, no ratio can eliminate the emotional challenges of trading.

    Understanding Risk-Reward Ratio and Win Rate

    A common misconception is that traders must win most of their trades to make a profit.

    In reality, the required win rate depends partly on the risk-reward ratio.

    For example, consider a trader who risks ₹100 to potentially earn ₹200 on every trade.

    ResultAmount
    Profit from one winning trade₹200
    Loss from one losing trade₹100
    Winning trades4
    Losing trades6
    Total profit₹800
    Total loss₹600
    Net result₹200

    In this simplified example, the trader wins only 4 out of 10 trades but still makes ₹200 before trading costs.

    This demonstrates why both win rate and risk-reward ratio matter.

    What Is the Break-Even Win Rate?

    The break-even win rate is the percentage of winning trades required to cover losses over time, before trading costs.

    The simplified formula is:

    Break-Even Win Rate = Risk ÷ (Risk + Reward) × 100

    For a 1:2 risk-reward ratio:

    ₹100 ÷ (₹100 + ₹200) × 100 = 33.33%

    This means a trader needs to win approximately 33.33% of trades to break even before fees and other costs, assuming every trade follows the planned risk and reward amounts.

    In practice, the required win rate may be higher because of fees, slippage, funding payments, and execution differences.

    Risk-Reward Ratio vs Position Sizing

    Although these concepts are connected, they serve different purposes.

    FeatureRisk-Reward RatioPosition Sizing
    MeaningCompares potential loss with potential profitDetermines how much of an asset to trade
    Main purposeEvaluates a trade’s potential payoffControls the amount of capital exposed
    Depends onEntry, stop-loss, and targetAccount size, risk limit, and stop-loss distance
    ExampleRisk ₹100 to potentially earn ₹300Buy 10 units based on the planned risk

    For effective risk management, traders should understand both concepts rather than relying on the risk-reward ratio alone.

    Common Mistakes Beginners Should Avoid

    Even though the calculation is simple, beginners can misunderstand how to use it.

    Avoid these mistakes:

    • Choosing unrealistic profit targets just to achieve a higher ratio.
    • Ignoring the possibility that a stop-loss may execute at a different price.
    • Forgetting trading fees and funding costs.
    • Assuming a 1:3 ratio guarantees profits.
    • Ignoring the win rate of a trading strategy.
    • Increasing position size because a trade appears to offer a favourable ratio.

    Instead, use realistic price levels and calculate your potential risk before entering a position.

    Frequently Asked Questions

    What is a good risk-reward ratio in crypto trading?

    There is no universally ideal ratio. Some traders use 1:2 or 1:3 as planning benchmarks, but the appropriate ratio depends on the strategy, market conditions, and probability of reaching the target.

    Is a 1:3 risk-reward ratio better than 1:2?

    A 1:3 ratio offers a larger potential reward relative to the planned risk. However, the profit target may be harder to reach. Therefore, the win rate and market conditions also matter.

    Can I make a profit with a low win rate?

    Yes. A strategy with a favourable risk-reward ratio may remain profitable even with a lower win rate. However, actual performance depends on execution, trading costs, and consistency.

    Does risk-reward ratio guarantee profits?

    No. It is a planning tool, not a prediction. Market movements, slippage, fees, and unexpected volatility can affect actual results.

    Should beginners use a risk-reward ratio?

    Understanding this concept can help beginners plan trades more carefully. However, they should also learn position sizing, stop-loss orders, and basic risk management before trading with real money.

    Disclaimer: This article is for educational purposes only and does not constitute financial or investment advice. Cryptocurrency trading involves significant risk, and you may lose some or all of your trading capital.

  • Open Interest vs Trading Volume: What is the difference?

    Open Interest vs Trading Volume: What is the difference?

    Introduction

    When analysing the cryptocurrency market, traders often look at trading volume and open interest to understand market activity. Although both indicators provide useful information, they measure different things.

    Trading volume shows how much trading activity takes place during a specific period. In contrast, open interest measures the number or value of outstanding derivative contracts that remain open.

    Understanding the difference between these indicators can help beginners interpret futures market activity more carefully.

    In this lesson, you will learn what open interest and trading volume mean, how they work, and how traders use them to understand market conditions.

    What is Trading Volume in Crypto?

    Trading volume refers to the total quantity or value of an asset traded during a specific period.

    For example, if traders buy and sell 100 BTC during a particular day, the reported trading volume may be 100 BTC, depending on the platform’s reporting method.

    Trading volume helps show how active a market is.

    Why Does Trading Volume Matter?

    Trading volume can provide useful information about market activity.

    • Market activity: Higher volume generally indicates more trading activity.
    • Price movements: A significant price movement accompanied by higher volume may indicate stronger participation.
    • Liquidity assessment: Volume can offer clues about market activity, although it does not guarantee sufficient liquidity.
    • Trend analysis: Traders may compare volume with price movements to understand market behaviour.

    However, high trading volume does not automatically mean that a market is healthy or that prices will continue moving in the same direction.

    What is Open Interest in Crypto?

    Open interest refers to the total number or value of outstanding derivative contracts that have not been closed, settled, or expired.

    It is commonly used in futures and perpetual futures markets.

    For example, imagine traders open 100 new futures contracts. If none of these contracts are closed or settled, open interest increases by 100 contracts.

    However, when existing positions are closed, open interest decreases.

    How Does Open Interest Change?

    Open interest changes when traders create or close derivative positions.

    Trading activityEffect on open interest
    Both sides open new positionsIncreases
    Both sides close existing positionsDecreases
    One trader opens while another closesGenerally remains unchanged

    Remember that every futures contract has both a buyer and a seller. Open interest counts the outstanding contract once, not once for each side.

    Why Does Open Interest Matter?

    Open interest helps traders understand how much derivative exposure remains active in the market.

    For example:

    • Rising open interest may indicate that new positions are being created.
    • Falling open interest may indicate that existing positions are being closed or settled.
    • High open interest indicates a large number or value of outstanding contracts.

    Nevertheless, open interest does not reveal whether the market is dominated by bullish or bearish traders. Every open contract has both a long and a short side.

    Open Interest vs Trading Volume: Key Differences

    Although both indicators measure market activity, they provide different information.

    FeatureTrading VolumeOpen Interest
    MeaningTotal trading activity during a periodOutstanding derivative contracts
    MeasuresHow much was tradedHow many contracts remain open
    Applies toSpot and derivatives marketsPrimarily derivatives markets
    Changes whenTrades take placePositions are opened or closed
    Time referenceUsually measured over a selected periodRepresents outstanding positions at a given time
    Main purposeUnderstand trading activityUnderstand active derivative exposure

    In simple terms, trading volume tells you how much trading has happened, while open interest tells you how many derivative contracts remain active.

    How to Interpret Open Interest and Trading Volume Together?

    Traders often examine both indicators alongside price movements. This combination can provide additional context about market participation.

    Here are four common situations:

    1. Price Rises, Open Interest Rises, and Volume Increases

    This combination may indicate growing market participation alongside an upward price movement.

    For example, new positions may be entering the market while buying activity increases.

    However, rising open interest does not confirm that all new positions are bullish. Every contract has both long and short exposure.

    2. Price Falls, Open Interest Rises, and Volume Increases

    This situation may indicate growing derivative activity during a downward price movement.

    New positions may be entering the market. Nevertheless, open interest alone cannot tell you whether traders are opening fresh short positions or taking the opposite side of existing activity.

    3. Price Rises While Open Interest Falls

    This combination may suggest that existing positions are closing while prices move higher.

    For instance, short positions may be getting closed, contributing to buying activity. However, additional information is needed to confirm the reason behind the movement.

    4. Price Falls While Open Interest Falls

    This may indicate that traders are reducing their existing exposure during a market decline.

    For example, long positions may be closing. Still, the indicators alone cannot establish exactly which positions are being closed.

    Important: These combinations are possible interpretations, not guaranteed trading signals. Always consider market conditions, funding rates, liquidity, and other relevant information.

    Practical Example: Understanding Both Indicators

    Imagine a Bitcoin perpetual futures market shows the following activity:

    IndicatorEarlier readingLater reading
    Trading volume5,000 BTC8,000 BTC
    Open interest20,000 BTC23,000 BTC

    In this example, trading volume increased from 5,000 BTC to 8,000 BTC. This indicates greater reported trading activity during the selected period.

    Meanwhile, open interest increased from 20,000 BTC to 23,000 BTC. This means the amount of outstanding contract exposure also increased.

    Together, these readings suggest that trading activity increased while more derivative contracts remained open.

    However, they do not reveal whether the market will move up or down next.

    Common Mistakes Beginners Should Avoid

    Open interest and trading volume can be useful indicators, but misinterpreting them can lead to poor trading decisions.

    Avoid these common mistakes:

    • Assuming high trading volume always means a price increase.
    • Treating rising open interest as proof of bullish sentiment.
    • Confusing trading volume with the number of active contracts.
    • Ignoring the selected time period when comparing volume.
    • Using open interest alone to predict market direction.
    • Assuming high open interest automatically means strong liquidity.

    Instead, combine these indicators with price action, liquidity, funding rates, and your overall trading plan.

    Frequently Asked Questions

    Is open interest the same as trading volume?

    No. Trading volume measures how much trading takes place during a period, while open interest measures outstanding derivative contracts that remain open.

    Does rising open interest mean the market is bullish?

    Not necessarily. Rising open interest indicates that outstanding contracts are increasing. It does not reveal whether the overall market is bullish or bearish.

    Can trading volume increase while open interest decreases?

    Yes. Traders can actively trade while closing existing positions. Therefore, trading volume may increase even as open interest declines.

    Is high open interest good for crypto trading?

    High open interest indicates substantial outstanding derivative exposure. However, it does not automatically mean the market has strong liquidity or lower risk.

    Why do traders monitor open interest and trading volume together?

    These indicators provide different information. When analysed together with price movements, they can help traders understand changes in market activity and outstanding positions.

    Disclaimer: This article is for educational purposes only and does not constitute financial or investment advice. Cryptocurrency derivatives involve significant risks, including the possibility of losing your entire margin.

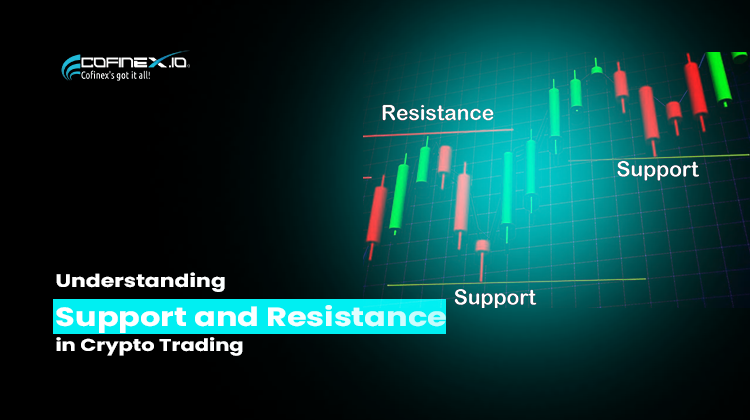
  • Understanding Support and Resistance in Crypto Trading

    Understanding Support and Resistance in Crypto Trading

    Introduction

    When you look at a crypto price chart, you may notice that prices sometimes stop falling near a particular area and start rising again. Similarly, prices may struggle to move higher after reaching certain levels.

    Traders often study these areas using two important concepts: support and resistance.

    Support is a price area where buying interest may slow a decline. In contrast, resistance is a price area where selling interest may slow a price increase.

    However, neither level guarantees that the price will reverse. Market conditions can change, and prices can break through both support and resistance.

    In this lesson, you’ll learn how these levels work, how traders identify them, and what beginners should understand before using them.

    What Is Support in Crypto Trading?

    Support is a price area where buying interest may increase enough to slow or temporarily stop a price decline.

    For example, imagine Bitcoin falls towards ₹80,00,000. Buyers begin purchasing near that area, and the price starts moving upward.

    If the price reacts similarly around that area on several occasions, traders may identify it as a support zone.

    However, support does not mean the price cannot fall further. If selling pressure becomes stronger than buying interest, the price may break below the zone.

    Why Does Support Form?

    Several factors can contribute to support:

    • Buying interest: Some traders consider an asset attractive when its price reaches a particular area.
    • Previous price reactions: Traders may watch areas where the price previously stopped falling or bounced upward.
    • Market psychology: Round numbers and widely watched price levels can influence trading decisions.
    • Trading activity: Increased buying activity around a price area may help slow a decline.

    As a result, traders often watch support zones to understand how the market responds to falling prices.

    What Is Resistance in Crypto Trading?

    Resistance is a price area where selling interest may increase enough to slow or temporarily stop a price rise.

    For example, suppose Bitcoin rises towards ₹85,00,000. Some traders sell near that area, and the price begins to fall.

    If the market shows similar reactions around that area repeatedly, traders may identify it as a resistance zone.

    Nevertheless, resistance does not guarantee a price decline. If buying demand becomes strong enough, the price may break above the zone.

    Why Does Resistance Form?

    Resistance can develop for several reasons:

    • Selling interest: Some traders may choose to sell when the price reaches a particular level.
    • Previous price reactions: Traders often watch areas where earlier price increases slowed or reversed.
    • Profit-taking: Traders who bought at lower prices may sell to realise profits.
    • Market psychology: Widely watched price levels can attract buying and selling activity.

    Therefore, resistance zones can help traders identify areas where the market may face selling pressure.

    Support vs Resistance: Key Differences

    FeatureSupportResistance
    LocationOften below the current priceOften above the current price
    Market pressureBuying interest may slow a declineSelling interest may slow an advance
    Possible reactionPrice may bounce upwardPrice may pull back downward
    Breakout directionPrice may break below supportPrice may break above resistance
    ReliabilityNot guaranteed to holdNot guaranteed to hold

    Remember that support and resistance represent price areas, not fixed barriers. Their significance depends on market conditions and price behaviour.

    A Simple Example of Support and Resistance

    Imagine a cryptocurrency trades between ₹100 and ₹120 for several days.

    During this period:

    • The price falls towards ₹100 and then rises several times.
    • The price climbs towards ₹120 and then falls several times.

    Traders may interpret ₹100 as a support zone and ₹120 as a resistance zone.

    If the price approaches ₹100 again, traders may watch whether buying interest appears. Similarly, when the price approaches ₹120, they may observe whether selling pressure increases.

    However, the price could break below ₹100 or above ₹120 at any time. Therefore, traders should not assume that the same pattern will continue indefinitely.

    How Do Traders Identify Support and Resistance?

    Traders use several methods to identify potential support and resistance zones.

    1. Look at Previous Price Reactions

    First, examine the price chart and look for areas where the price repeatedly stopped falling or rising.

    For example, several upward reactions near a similar price may suggest a potential support zone.

    Likewise, repeated downward reactions near a similar price may indicate possible resistance.

    2. Identify Price Zones, Not Just Exact Numbers

    Support and resistance rarely work as perfectly precise lines.

    Instead, traders often mark a zone that covers several nearby price reactions. This approach recognises that buying and selling activity can occur across a range of prices.

    3. Observe Trading Volume

    Trading volume shows how much of an asset traders exchange during a particular period.

    Some traders examine volume when the price approaches a support or resistance zone. A change in volume may provide additional context, although volume alone cannot confirm whether a level will hold or break.

    4. Use Different Timeframes

    A price area that matters on a short-term chart may not carry the same significance on a longer-term chart.

    For this reason, traders sometimes compare multiple timeframes to understand the broader price structure.

    However, no timeframe guarantees a more accurate outcome.

    What Happens When Support or Resistance Breaks?

    Sometimes, the price moves through a support or resistance zone instead of reversing.

    Support Breaks

    When the price moves below support, it may indicate that selling pressure has increased. Some traders then watch whether the price continues falling or returns above the zone.

    In certain situations, a broken support zone may later act as resistance.

    Resistance Breaks

    When the price moves above resistance, it may indicate stronger buying pressure. Traders may then watch whether the price continues rising or falls back below the zone.

    In some cases, a broken resistance zone may later act as support.

    This behaviour is often called role reversal. However, it does not happen every time, and a brief move beyond a level may turn out to be a false breakout.

    Common Beginner Mistakes

    Treating levels as guarantees: Support can break, and resistance can fail.

    Drawing too many lines: Marking every small price movement can make a chart confusing. Focus on meaningful price reactions instead.

    Ignoring market conditions: News, volatility, liquidity, and broader market trends can influence how prices behave around these zones.

    Assuming every breakout will continue: Some breakouts reverse quickly. Traders should consider the wider market context.

    Relying on one signal alone: Support and resistance provide context, but they do not predict future prices with certainty

    FAQs

    What is support in crypto trading?

    Support is a price area where buying interest may slow a decline or encourage a temporary upward reaction.

    What is resistance in crypto trading?

    Resistance is a price area where selling interest may slow a price increase or encourage a temporary downward reaction.

    Can support become resistance?

    Yes. After the price breaks below a support zone, that zone may act as resistance if the price later returns to it. However, this behaviour is not guaranteed.

    Can resistance become support?

    Yes. When the price breaks above resistance, that zone may later act as support if the price returns to it.

    Is support and resistance enough to make a trading decision?

    No. These concepts help traders interpret price behaviour, but they cannot guarantee an outcome. Traders should also consider risk management, market conditions, and other relevant information.

    Disclaimer

    This article is for educational purposes only and does not provide financial or investment advice. Cryptocurrency markets are volatile, and support and resistance levels can fail. Always understand the risks before making trading decisions.

  • What is Trading Volume?

    What is Trading Volume?

    Introduction

    Have you ever noticed that some cryptocurrencies are traded more actively than others? Some attract many buyers and sellers, while others see very little trading activity. One useful metric that helps you understand this activity is trading volume.

    Trading volume shows how much of a cryptocurrency has been traded during a specific period. It can help traders understand market activity, compare trading interest, and interpret price movements.

    However, high trading volume does not automatically mean a cryptocurrency is a good investment. To understand what the numbers tell you, let’s explore trading volume in simple terms.

    What Is Trading Volume?

    Trading volume refers to the total amount of an asset traded during a specific period, such as one hour, 24 hours, or one day.

    For example, suppose traders buy and sell 500 BTC over a 24-hour period. The reported trading volume for that period may be 500 BTC, depending on the market and the platform’s reporting method.

    Volume can be measured in two common ways:

    • Asset volume: The amount of cryptocurrency traded, such as 500 BTC.
    • Trading value: The total value of those trades in a currency, such as USDT or INR.

    Therefore, always check which unit a platform uses when displaying trading volume.

    How Does Trading Volume Work?

    Every completed trade involves a buyer and a seller. Trading volume measures the amount traded across those transactions.

    Imagine the following trades take place in a BTC/USDT market:

    TradeAmount of BTC traded
    Trade 10.5 BTC
    Trade 21 BTC
    Trade 30.25 BTC
    Total1.75 BTC

    The total trading volume across these three trades is 1.75 BTC.

    Notice that the calculation counts the amount traded, not the number of people participating. A single trader can complete several transactions, and each trade contributes to the reported volume according to the platform’s methodology.

    Why Is Trading Volume Important?

    Trading volume gives traders additional context about price movements.

    1. Understanding Market Activity

    Higher volume generally indicates that more of an asset is being traded during the measured period.

    Lower volume may indicate less trading activity. However, volume can vary depending on the asset, exchange, time of day, and market conditions.

    2. Confirming Price Movements

    Traders often study volume alongside price.

    For example, if a cryptocurrency’s price rises while trading volume also increases, it may indicate stronger participation in that upward movement.

    On the other hand, if the price rises while volume declines, fewer units may be changing hands during the move.

    Nevertheless, neither pattern guarantees what the price will do next.

    3. Comparing Trading Interest

    Volume can help you compare the level of activity across different assets or trading pairs.

    However, make sure you compare similar time periods and units. A 24-hour volume figure should not be compared directly with a one-hour figure without accounting for the difference.

    4. Supporting Trading Decisions

    Traders may use volume alongside price charts, order books, and other indicators to understand market conditions.

    For example, a trader may examine whether a breakout occurs alongside increased trading activity.

    Still, volume is only one piece of information. It cannot predict market direction on its own.

    What Is the Difference Between High and Low Trading Volume?

    Does the Momentum Indicator Confirm Trend Strength? | EBC Financial Group

    High Trading Volume

    A larger amount of the asset is traded during the selected period. This can reflect increased market activity, but it does not necessarily mean the price will rise.

    Graph Chart Stock Market Candle Stick Trade Business Data Growth Money Diagram blur Blue Background, Abstract Global Forex Bitcoin Crypto currency, Technology Analysis Exchange Profit Success.

    Low Trading Volume

    A smaller amount of the asset is traded during the selected period. Depending on the market, this may mean fewer trading opportunities or less liquidity near the current price.

    Importantly, trading volume and liquidity are not the same thing. Volume measures trading activity over a period, while liquidity describes how easily an asset can be bought or sold without significantly affecting its price.

    What Does Volume Tell You About Price Movements?

    Traders often look at price and volume together because the combination can provide more context than either metric alone.

    Price Rises and Volume Increases

    This may indicate growing participation in the upward move. However, it does not guarantee that the trend will continue.

    Price Falls and Volume Increases

    This may indicate strong trading activity during a decline. It does not, by itself, prove that the price will continue falling.

    Price Moves With Low Volume

    A price movement with relatively low volume may have less participation behind it. Still, the significance depends on the asset and the wider market.

    Volume Spikes Suddenly

    A sudden increase in volume can occur around major announcements, market volatility, liquidations, or other events.

    Therefore, check the context before drawing conclusions from a volume spike.

    What Is a Trading Volume Chart?

    A trading volume chart often appears below a cryptocurrency’s price chart.

    It commonly displays vertical bars, with each bar representing the volume traded during a particular time interval.

    For example:

    • A one-minute chart shows volume for each minute.
    • An hourly chart shows volume for each hour.
    • A daily chart shows volume for each day.

    Some charts use different colours to distinguish periods when prices rose or fell. However, the exact colour conventions depend on the charting platform.

    When reading a volume chart, compare recent bars with previous bars from the same chart and time frame. This helps you understand whether trading activity is unusually high or low for that market.

    What Is the Difference Between Trading Volume and Market Capitalization?

    These two metrics describe different things.

    FeatureTrading VolumeMarket Capitalization
    What it measuresTrading activity during a periodCurrent market value of circulating tokens
    Basic calculationTotal amount tradedPrice × circulating supply
    Changes whenTrading activity changesPrice or circulating supply changes
    What it helps explainHow actively an asset is tradedThe asset’s market value based on circulating supply

    For example, a cryptocurrency may have a large market capitalization but relatively low daily trading volume. Another asset may have a smaller market capitalization but trade actively.

    Consequently, neither metric should be used alone to judge an asset.

    Common Beginner Mistakes

    Assuming high volume means the price will rise. High volume can occur during both upward and downward price movements.

    Ignoring the time frame. One-hour volume and 24-hour volume describe different periods.

    Confusing volume with liquidity. An asset can record substantial volume but still experience poor liquidity at a particular moment or on a particular exchange.

    Comparing figures without checking the units. Some platforms report volume in the traded cryptocurrency, while others display its estimated value in a currency.

    Trusting every reported figure. Volume data quality can vary across exchanges and data providers. Reported activity may not always reflect the same level of genuine market participation.

    FAQs

    Is high trading volume good for a cryptocurrency?

    High volume can indicate active trading, but it does not automatically make an asset a good investment. Consider liquidity, price behaviour, market conditions, and the reliability of the data.

    Does high trading volume mean the price will increase?

    No. High volume can accompany rising prices, falling prices, or periods of sharp volatility.

    What does 24-hour trading volume mean?

    It represents the reported amount traded over a 24-hour period. Depending on the platform, it may be shown in cryptocurrency units or monetary value.

    Is trading volume the same as liquidity?

    No. Volume measures completed trading activity over a period. Liquidity describes how easily an asset can be traded without significantly affecting its price.

    Where can I check crypto trading volume?

    You can usually find volume figures on cryptocurrency exchange trading pages and market-data platforms. Compare similar time periods and check how each platform calculates its figures.

    Disclaimer

    This article is for educational purposes only and does not provide financial or investment advice. Cryptocurrency markets involve risk, and trading volume cannot predict future price movements or guarantee trading outcomes.

  • What is a Market Order? A Beginner’s Guide to Crypto Trading

    What is a Market Order? A Beginner’s Guide to Crypto Trading

    Introduction

    When you trade cryptocurrency, you need to choose how you want to buy or sell an asset.

    One of the simplest options is a market order.

    A market order tells the exchange that you want to buy or sell an asset immediately at the best available prices in the market.

    Unlike a limit order, you do not set a specific price for the trade. Instead, the exchange matches your order with available orders in the market.

    As a result, market orders can be useful when getting an immediate execution is more important than choosing an exact price.

    However, the final price may differ from the price you see when placing the order. Therefore, beginners should understand how market orders work before using them.

    What is a Market Order?

    A market order is an instruction to buy or sell an asset at the best available prices when the order reaches the market.

    For example, suppose BTC is trading around 100,000 USDT.

    You want to buy BTC immediately. Instead of entering a specific price, you place a market buy order.

    The exchange then matches your order with available sell orders.

    Therefore, your trade can execute quickly, but the exact execution price is not guaranteed.

    The final price depends on the available orders in the market at that moment.

    How does a Market Order work?

    The process is relatively simple.

    First, you choose the cryptocurrency and trading pair you want to trade.

    Next, you select the market order option.

    Then, you enter the amount you want to buy or sell.

    After that, you submit the order.

    The exchange looks at the available orders on the other side of the market. For a buy order, it matches your order with available sell orders. For a sell order, it matches your order with available buy orders.

    Finally, the exchange completes the trade as matching orders become available.

    Because the market can change quickly, the execution price can vary during this process.

    A Simple Market Order Example

    Imagine the BTC/USDT market currently has these sell orders:

    PriceAvailable BTC
    100,000 USDT0.50 BTC
    100,100 USDT0.30 BTC
    100,200 USDT0.40 BTC

    Now suppose you place a market order to buy 0.70 BTC.

    The first 0.50 BTC may be available at 100,000 USDT.

    However, only 0.20 BTC remains to complete your order. The exchange may therefore match the remaining amount at the next available price of 100,100 USDT.

    As a result, your entire order may not execute at one single price.

    This is one reason why understanding the order book is useful before placing a market order.

    Market Order vs Limit Order

    Market orders and limit orders work differently.

    Market OrderLimit Order
    Aims for immediate executionExecutes only at the specified price or a better price
    Does not set an exact execution priceLets you set the price
    Uses available orders in the marketWaits for matching orders
    Final price can varyPrice is controlled by the order limit
    Can be useful when speed mattersCan be useful when price control matters

    In short, the order focuses on execution, while a limit order focuses on price control.

    However, neither order type guarantees a particular trading outcome.

    What is Slippage?

    Slippage is the difference between the expected price of a trade and the actual execution price.

    For example, you may see BTC at 100,000 USDT and place a market buy order.

    However, if there are not enough sellers at that price, part of your order may execute at higher prices.

    Therefore, your average execution price could be above 100,000 USDT.

    Slippage can become more noticeable when:

    • The market is moving quickly
    • The trading pair has lower liquidity
    • The order is relatively large
    • There are fewer orders near the current price

    For this reason, checking the available market depth can help you understand the conditions before placing a larger order.

    Why Can the Final Price Be Different?

    A market order does not lock in the price shown on your screen.

    Instead, it uses the available orders when the exchange processes the trade.

    Crypto markets can change within seconds. At the same time, traders can place or cancel orders.

    As a result, the available prices may change before your order is fully executed.

    This means the displayed price and the final execution price can sometimes be different.

    Benefits of Market Orders

    Quick Execution

    A market order aims to execute immediately using available orders.

    Therefore, it can be useful when you want to enter or exit a position without waiting for a specific price.

    Simple to Use

    Market orders are straightforward for beginners.

    You only need to select the asset, choose the market order option, and enter the amount.

    Useful in Active Markets

    When a trading pair has strong liquidity, many orders may be available near the current price.

    As a result, market orders may experience less price movement during execution than they might in a market with limited liquidity.

    Risks of Market Orders

    The Price Is Not Fixed

    The biggest point to remember is that a market order does not guarantee an exact execution price.

    Instead, the final price depends on available orders.

    Slippage Can Occur

    If the market has limited liquidity or moves quickly, your order may execute across several price levels.

    Consequently, your average execution price can differ from the price you expected.

    Large Orders Can Affect Execution

    A large order may use several available price levels.

    Therefore, larger trades require more attention to market depth and liquidity.

    When Should Beginners Be Careful?

    Before placing a market order, consider the current market conditions.

    First, check the trading pair and make sure you have selected the correct asset.

    Next, look at the available buy and sell orders.

    Then, consider the size of your order compared with the available market depth.

    Finally, review the amount and trading details before confirming the transaction.

    These simple checks can help reduce avoidable mistakes.

    Common Beginner Mistakes

    Assuming the Displayed Price Is Guaranteed

    The price shown on the trading screen can change quickly.

    Therefore, do not assume that your entire market order will execute at that exact price.

    Ignoring Liquidity

    A trading pair with limited liquidity may have fewer available orders.

    As a result, larger orders can experience greater price differences during execution.

    Placing the Wrong Order

    Always check whether you selected a buy or sell order before confirming the trade.

    Ignoring Order Size

    A small order and a large order can interact with the market differently.

    For this reason, beginners should understand the available market depth before placing larger orders.

    FAQs

    What is a market order in crypto?

    It is an instruction to buy or sell a cryptocurrency at the best available prices when the order is processed.

    Does a market order guarantee a price?

    No. It aims for execution rather than a specific price.

    Can a market order have slippage?

    Yes. Slippage can occur when the available prices change or when there are not enough orders at the expected price.

    Is a market order executed immediately?

    It is designed for immediate execution, but the actual execution process depends on available orders and market conditions.

    What is the difference between a market order and a limit order?

    It prioritizes execution at available prices. A limit order lets you specify the price at which you are willing to buy or sell.

    Can a large market order affect the execution price?

    Yes. A large order may consume available orders at several price levels. As a result, its average execution price can differ from the initial displayed price.

    Disclaimer

    This lesson is for educational purposes only. It does not provide financial, investment, trading, or legal advice.

    Crypto markets can be volatile, and trading involves risk. Therefore, always understand an order type and its potential risks before placing a trade.

  • Common Crypto Investment Mistakes Every Beginner Should Avoid

    Common Crypto Investment Mistakes Every Beginner Should Avoid

    Have you ever heard someone say, “I bought the wrong coin and lost my money” or “I sold too early and missed a great opportunity”?

    If you’re new to cryptocurrency, these situations may sound familiar. Every year, many beginners enter the crypto market hoping to earn quick profits. However, they often make simple mistakes because they don’t fully understand how the market works.

    The good news is that you can avoid many of these mistakes with the right knowledge.

    In this lesson, you’ll learn the most common crypto investment mistakes and discover practical ways to avoid them.

    1. Investing without doing your own research

    One of the biggest mistakes beginners make is buying a cryptocurrency simply because someone else recommends it.

    For example, you might watch a video where an influencer says a particular coin will “go to the moon.” Similarly, you may hear friends talking about the next big cryptocurrency. Although these opinions sound exciting, they should never replace your own research.

    Before investing, ask yourself a few simple questions.

    • What problem does this project solve?
    • Who created it?
    • Does the project have an active community?
    • Does it have a clear purpose?

    The more you learn, the more confident you’ll feel when making investment decisions.

    If you’re just starting your crypto journey, begin with the What is Bitcoin? and What is Ethereum? lessons before exploring smaller cryptocurrencies.

    2. Letting emotions make your decisions

    The cryptocurrency market can change quickly. Sometimes prices rise within hours, while at other times they fall just as fast.

    Because of this, many beginners buy when prices are high because they fear missing out. On the other hand, some investors panic and sell during market corrections because they worry prices will continue to fall.

    Instead of reacting emotionally, create a simple plan before you invest. Then, stick to your plan even when the market becomes volatile.

    Remember, successful investing often requires patience.

    3. Investing more than you can afford to lose

    Cryptocurrency can offer opportunities, but it also involves risk.

    For this reason, never invest money that you need for rent, education, household expenses, or emergencies.

    Instead, invest only an amount that you are comfortable losing if the market moves against you.

    This simple habit can protect both your finances and your peace of mind.

    4. Putting all your money into one coin

    Many beginners believe they have found the next Bitcoin. As a result, they invest all their money in a single cryptocurrency.

    Although that strategy may work occasionally, it also increases risk.

    Imagine carrying all your important documents in one bag. If you lose the bag, you lose everything.

    The same idea applies to investing.

    Instead, many experienced investors spread their money across different assets. This approach is called diversification. While diversification cannot remove risk completely, it can reduce the impact if one investment performs poorly.

    5. Ignoring basic market analysis

    Some beginners buy cryptocurrency without checking market trends or understanding price movements.

    You don’t need to become an expert overnight. However, learning a few basic concepts can help you make better decisions.

    For example, understanding support and resistance levels or recognizing simple chart patterns can improve your confidence over time.

    As you continue learning, the Technical Analysis lessons in the Cofinex Academy will help you build these skills step by step.

    6. Investing without an exit plan

    Buying cryptocurrency is only one part of investing. Knowing when to sell is equally important.

    Unfortunately, many beginners focus only on buying and forget to plan their exit.

    Before making your investment, decide:

    • When will you take some profit?
    • How much loss are you willing to accept?
    • Are you investing for a few months or several years?

    Having a clear plan helps you stay calm when prices move unexpectedly.

    7. Expecting every coin to become the next bitcoin

    Bitcoin has delivered remarkable long-term growth since its launch in 2009. Because of its success, many beginners hope to find another cryptocurrency that will produce similar returns.

    However, thousands of cryptocurrencies exist today, and each project serves a different purpose.

    Instead of searching for the “next Bitcoin,” focus on understanding the projects you invest in. A realistic approach usually leads to better decisions than chasing unrealistic expectations.

    Learning is your best investment

    Many beginners think making money is the first goal in cryptocurrency.

    In reality, learning should come first.

    The more you understand blockchain technology, cryptocurrencies, and market behavior, the more confident you’ll become when making investment decisions.

    Building your knowledge today can help you avoid costly mistakes tomorrow.

    Frequently Asked Questions

    Why do beginners lose money in cryptocurrency?

    Many beginners lose money because they invest without enough research, follow social media hype, or make emotional decisions during market fluctuations.

    Should I invest all my money in one cryptocurrency?

    No. Spreading your investments across different assets may help reduce risk if one cryptocurrency performs poorly.

    Is cryptocurrency a guaranteed way to make money?

    No. Cryptocurrency prices can rise or fall at any time. Every investment involves risk, so always invest responsibly.

    Why should I research before investing?

    Research helps you understand a project’s purpose, team, technology, and potential risks before you invest your money.

    Where can I learn more about cryptocurrency?

    The Cofinex Academy offers beginner-friendly lessons on Bitcoin, Ethereum, USDT, Blockchain Technology, Crypto Wallets, and Crypto Trading to help you build your knowledge step by step.

    Disclaimer

    This lesson is for educational purposes only. It does not provide financial, investment, or legal advice. Cryptocurrency investments involve risk. Always do your own research and consider your financial situation before making investment decisions.

    Trade on the Go with the Cofinex Mobile App

    Download for Android

    Download for iOS

    Follow Cofinex

    Telegram: https://t.me/cofinexofficial

    X (Twitter): https://x.com/CofinexExchange

    Facebook: https://www.facebook.com/

    Instagram: https://www.instagram.com/cofinexexchange/

    LinkedIn: https://in.linkedin.com/company/cofinexexchange

    WhatsApp Channel: https://whatsapp.com/channel/0029VbBSQtJ2P59lfbaRXJ2k
    YouTube: https://www.youtube.com/@cofinexexchange